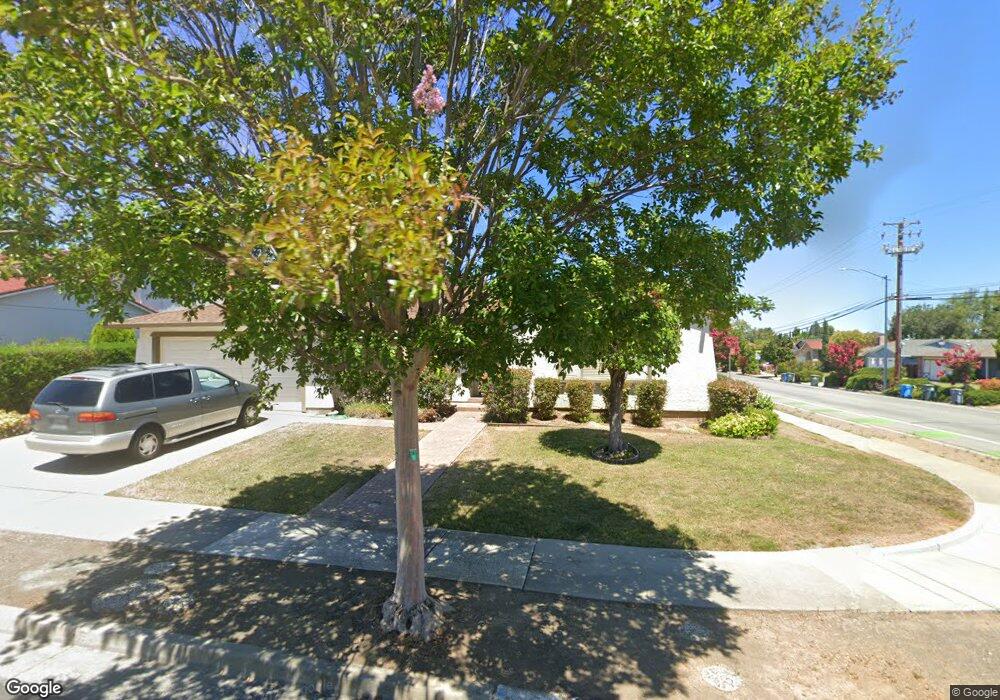
21529 Edward Way Cupertino, CA 95014
McClellan NeighborhoodEstimated Value: $3,127,947 - $3,916,000
3
Beds
2
Baths
1,738
Sq Ft
$2,008/Sq Ft
Est. Value
About This Home
This home is located at 21529 Edward Way, Cupertino, CA 95014 and is currently estimated at $3,490,737, approximately $2,008 per square foot. 21529 Edward Way is a home located in Santa Clara County with nearby schools including Abraham Lincoln Elementary School, John F. Kennedy Middle School, and Monta Vista High School.
Ownership History
Date
Name
Owned For
Owner Type
Purchase Details
Closed on
Dec 15, 2016
Sold by
Chu David Chiu Tsun and Liu Yaping
Bought by
Chu David Chiu Tsun and Liu Yaping
Current Estimated Value
Purchase Details
Closed on
Apr 10, 2002
Sold by
Smith Bud E and Lewis Smith Jacyn O
Bought by
Chu David Chiu Tsun and Liu Yaping
Home Financials for this Owner
Home Financials are based on the most recent Mortgage that was taken out on this home.
Original Mortgage
$640,800
Outstanding Balance
$254,994
Interest Rate
6.25%
Estimated Equity
$3,235,743
Purchase Details
Closed on
Jul 26, 1997
Sold by
Pauline Czapkay and Maher Timothy
Bought by
Smith Bud E and Lewis Smith Jacyn O
Home Financials for this Owner
Home Financials are based on the most recent Mortgage that was taken out on this home.
Original Mortgage
$430,000
Interest Rate
6.95%
Create a Home Valuation Report for This Property
The Home Valuation Report is an in-depth analysis detailing your home's value as well as a comparison with similar homes in the area
Home Values in the Area
Average Home Value in this Area
Purchase History
| Date | Buyer | Sale Price | Title Company |
|---|---|---|---|
| Chu David Chiu Tsun | -- | None Available | |
| Chu David Chiu Tsun | $801,000 | Alliance Title Company | |
| Smith Bud E | $537,500 | Stewart Title |
Source: Public Records
Mortgage History
| Date | Status | Borrower | Loan Amount |
|---|---|---|---|
| Open | Chu David Chiu Tsun | $640,800 | |
| Previous Owner | Smith Bud E | $430,000 |
Source: Public Records
Tax History Compared to Growth
Tax History
| Year | Tax Paid | Tax Assessment Tax Assessment Total Assessment is a certain percentage of the fair market value that is determined by local assessors to be the total taxable value of land and additions on the property. | Land | Improvement |
|---|---|---|---|---|
| 2025 | $14,459 | $1,183,299 | $886,373 | $296,926 |
| 2024 | $14,459 | $1,160,098 | $868,994 | $291,104 |
| 2023 | $14,320 | $1,137,352 | $851,955 | $285,397 |
| 2022 | $14,254 | $1,115,051 | $835,250 | $279,801 |
| 2021 | $14,096 | $1,093,188 | $818,873 | $274,315 |
| 2020 | $13,918 | $1,081,980 | $810,477 | $271,503 |
| 2019 | $13,571 | $1,060,766 | $794,586 | $266,180 |
| 2018 | $13,177 | $1,039,967 | $779,006 | $260,961 |
| 2017 | $13,080 | $1,019,577 | $763,732 | $255,845 |
| 2016 | $12,576 | $999,586 | $748,757 | $250,829 |
| 2015 | $12,475 | $984,572 | $737,510 | $247,062 |
| 2014 | $12,149 | $965,287 | $723,064 | $242,223 |
Source: Public Records
Map
Nearby Homes
- 21710 Regnart Rd
- 820 Hooshang Ct
- 902 Sage Ct
- 21091 Red Fir Ct
- 21685 Olive Ave
- 1122 Scotland Dr
- 21851 Almaden Ave
- 21670 Lomita
- 20882 Cherryland Dr
- 1258 S Stelling Rd
- 1270 S Stelling Rd
- 22346 Mcclellan Rd
- 7438 Stanford Place
- 10961 Kester Dr
- 10893 Canyon Vista Dr
- 00 Cleo Ave
- 22113 Stocklmeir Ct
- 10546 Merriman Rd
- 22645 San Juan Rd
- 7344 Rainbow Dr