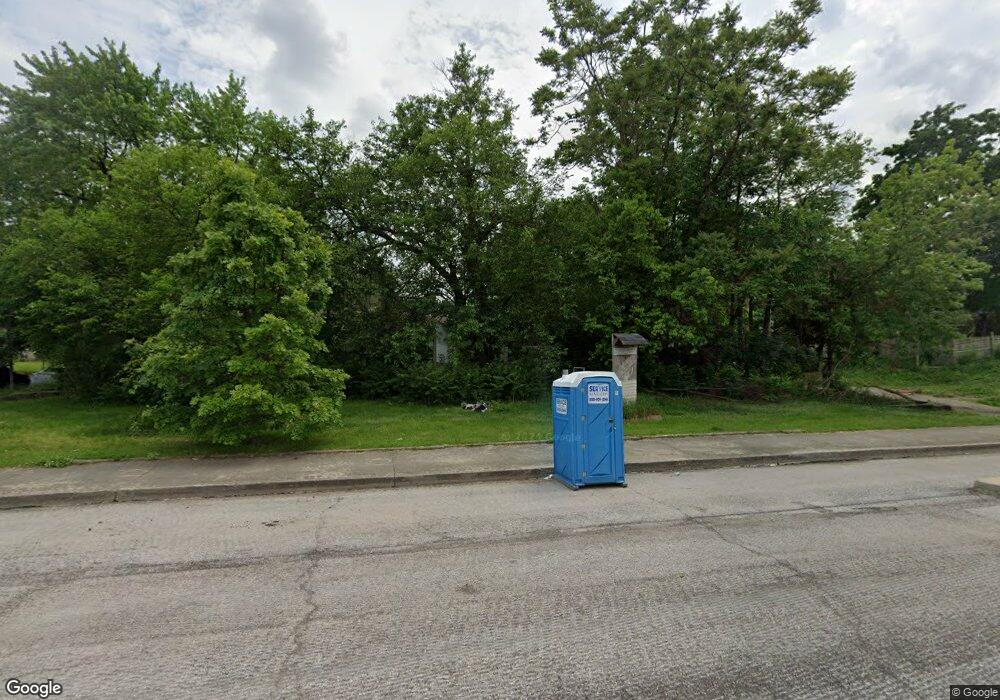
2153 E New York St Indianapolis, IN 46201
Near Eastside NeighborhoodEstimated Value: $101,000 - $339,000
--
Bed
--
Bath
--
Sq Ft
4,792
Sq Ft Lot
About This Home
This home is located at 2153 E New York St, Indianapolis, IN 46201 and is currently estimated at $220,000. 2153 E New York St is a home located in Marion County with nearby schools including Thomas D. Gregg School No. 15, Washington Irving School 14, and Anna Brochhausen School 88.
Ownership History
Date
Name
Owned For
Owner Type
Purchase Details
Closed on
Oct 16, 2015
Sold by
Riley Area Development Corporation
Bought by
Radc Holdings Llc
Current Estimated Value
Purchase Details
Closed on
Feb 8, 2008
Sold by
City Of Indianapolis
Bought by
Riley Area Development Corporation
Purchase Details
Closed on
Nov 16, 2006
Sold by
Marion County Board Of Commissioners Cit
Bought by
Department Of Metropolitan Development
Purchase Details
Closed on
Oct 19, 2006
Sold by
Howard Clark and Howard George
Bought by
Howard Clark and Howard George
Create a Home Valuation Report for This Property
The Home Valuation Report is an in-depth analysis detailing your home's value as well as a comparison with similar homes in the area
Home Values in the Area
Average Home Value in this Area
Purchase History
| Date | Buyer | Sale Price | Title Company |
|---|---|---|---|
| Radc Holdings Llc | -- | None Available | |
| Riley Area Development Corporation | -- | Fat | |
| Department Of Metropolitan Development | -- | None Available | |
| Howard Clark | -- | None Available |
Source: Public Records
Tax History Compared to Growth
Tax History
| Year | Tax Paid | Tax Assessment Tax Assessment Total Assessment is a certain percentage of the fair market value that is determined by local assessors to be the total taxable value of land and additions on the property. | Land | Improvement |
|---|---|---|---|---|
| 2024 | -- | $9,200 | $9,200 | -- |
| 2023 | -- | $9,200 | $9,200 | $0 |
| 2022 | $0 | $9,200 | $9,200 | $0 |
| 2021 | $0 | $9,200 | $9,200 | $0 |
| 2020 | $62 | $2,100 | $2,100 | $0 |
| 2019 | $63 | $2,100 | $2,100 | $0 |
| 2018 | $65 | $2,100 | $2,100 | $0 |
| 2017 | $58 | $2,100 | $2,100 | $0 |
| 2016 | $55 | $2,100 | $2,100 | $0 |
| 2014 | $61 | $2,100 | $2,100 | $0 |
| 2013 | -- | $0 | $0 | $0 |
Source: Public Records
Map
Nearby Homes
- 2209 E New York St
- 247 Hendricks Place
- 206 N Hamilton Ave
- 206 N Beville Ave
- 249 N Beville Ave
- 207 Parkview Ave
- 14 Jefferson Ave
- 49 N Beville Ave
- 337 N Beville Ave
- 226 N Randolph St
- 37 N Beville Ave
- 237 N Keystone Ave
- 1831 E Marlowe Ave
- 19 Parkview Ave
- 17 Parkview Ave
- 206 N Randolph St
- 43 N Walcott St
- 2002 E Washington St
- 430 N Keystone Ave
- 17 N Randolph St
- 242 Jefferson Ave
- 302 Jefferson Ave
- 2201 E New York St
- 236 Jefferson Ave
- 247 N Hamilton Ave
- 243 N Hamilton Ave
- 310 Jefferson Ave
- 241 Jefferson Ave
- 301 N Hamilton Ave
- 2205 E New York St
- 245 Jefferson Ave
- 2207 E New York St
- 314 Jefferson Ave
- 237 Jefferson Ave
- 309 N Hamilton Ave
- 305 Jefferson Ave
- 239 Jefferson Ave
- 226 Jefferson Ave
- 2211 E New York St
- 233 Jefferson Ave