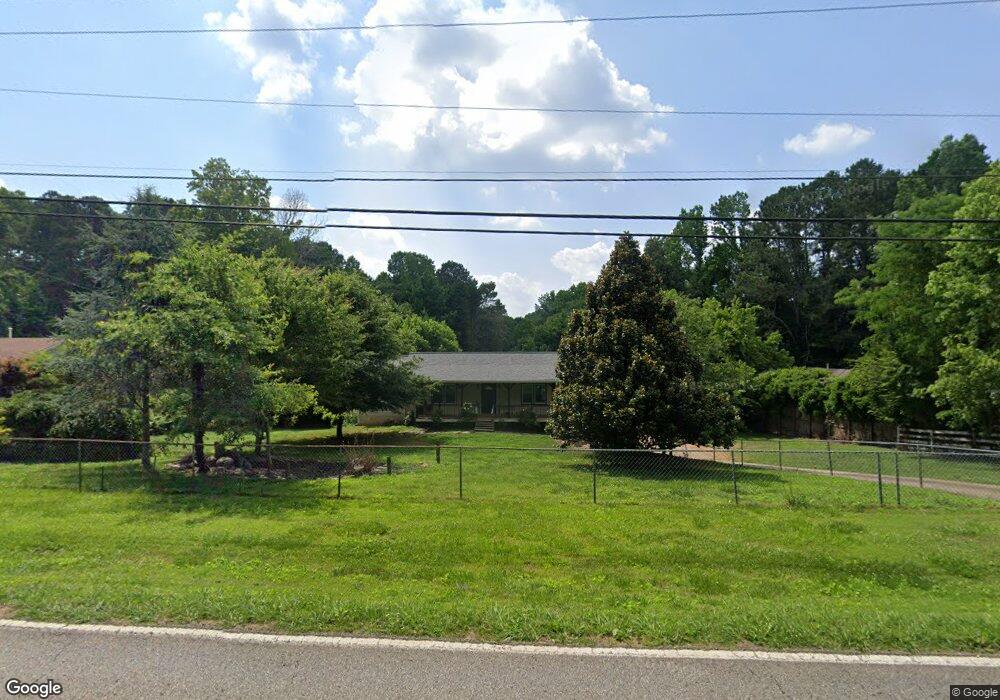
2153 Toonigh Rd Canton, GA 30115
Estimated Value: $211,000 - $374,117
3
Beds
2
Baths
1,572
Sq Ft
$188/Sq Ft
Est. Value
About This Home
This home is located at 2153 Toonigh Rd, Canton, GA 30115 and is currently estimated at $294,779, approximately $187 per square foot. 2153 Toonigh Rd is a home located in Cherokee County with nearby schools including Holly Springs Elementary School, Rusk Middle School, and Sequoyah High School.
Ownership History
Date
Name
Owned For
Owner Type
Purchase Details
Closed on
Jun 29, 2020
Sold by
Reece Erica W
Bought by
Kring Victoria and Kring Brandyn
Current Estimated Value
Home Financials for this Owner
Home Financials are based on the most recent Mortgage that was taken out on this home.
Original Mortgage
$211,105
Outstanding Balance
$186,357
Interest Rate
3.1%
Mortgage Type
FHA
Estimated Equity
$108,422
Purchase Details
Closed on
May 20, 2014
Sold by
Reece Christopher Justin
Bought by
Reece Erica W
Purchase Details
Closed on
Oct 17, 2008
Sold by
Reece Erica W
Bought by
Reece Christopher J and Reece Erica W
Home Financials for this Owner
Home Financials are based on the most recent Mortgage that was taken out on this home.
Original Mortgage
$120,745
Interest Rate
6.34%
Mortgage Type
FHA
Create a Home Valuation Report for This Property
The Home Valuation Report is an in-depth analysis detailing your home's value as well as a comparison with similar homes in the area
Home Values in the Area
Average Home Value in this Area
Purchase History
| Date | Buyer | Sale Price | Title Company |
|---|---|---|---|
| Kring Victoria | $215,000 | -- | |
| Reece Erica W | -- | -- | |
| Reece Christopher J | -- | -- | |
| Reece Erica W | $122,000 | -- |
Source: Public Records
Mortgage History
| Date | Status | Borrower | Loan Amount |
|---|---|---|---|
| Open | Kring Victoria | $211,105 | |
| Previous Owner | Reece Erica W | $120,745 |
Source: Public Records
Tax History Compared to Growth
Tax History
| Year | Tax Paid | Tax Assessment Tax Assessment Total Assessment is a certain percentage of the fair market value that is determined by local assessors to be the total taxable value of land and additions on the property. | Land | Improvement |
|---|---|---|---|---|
| 2025 | $2,437 | $101,820 | $28,000 | $73,820 |
| 2024 | $2,353 | $98,300 | $28,000 | $70,300 |
| 2023 | $1,960 | $100,300 | $28,000 | $72,300 |
| 2022 | $2,156 | $87,740 | $21,200 | $66,540 |
| 2021 | $2,034 | $74,860 | $16,000 | $58,860 |
| 2020 | $1,969 | $69,300 | $16,000 | $53,300 |
| 2019 | $1,777 | $62,520 | $15,200 | $47,320 |
| 2018 | $1,607 | $56,200 | $12,400 | $43,800 |
| 2017 | $1,361 | $131,200 | $11,200 | $41,280 |
| 2016 | $1,361 | $116,900 | $11,200 | $35,560 |
| 2015 | $1,390 | $118,200 | $11,200 | $36,080 |
| 2014 | $1,283 | $108,900 | $11,200 | $32,360 |
Source: Public Records
Map
Nearby Homes
- 2119 Toonigh Rd
- 2183 Toonigh Rd
- 0 Apple Orchard Ln Unit 7452399
- 5001 Apple Orchard Ln
- 2100 Toonigh Rd
- 5011 Apple Orchard Ln
- 6013 Jonathan Trace Unit II
- 2095 Toonigh Rd
- 2098 Toonigh Rd
- 2120 Toonigh Rd
- 6033 Jonathan Trace
- 6033 Jonathan Trace Unit Tr
- 5021 Apple Orchard Ln
- 2130 Toonigh Rd
- 5000 Apple Orchard Ln
- 2096 Toonigh Rd
- 2061 Toonigh Rd
- 5004 Apple Orchard Ln
- 6043 Jonathan Trace
- 4805 Apple Orchard Way