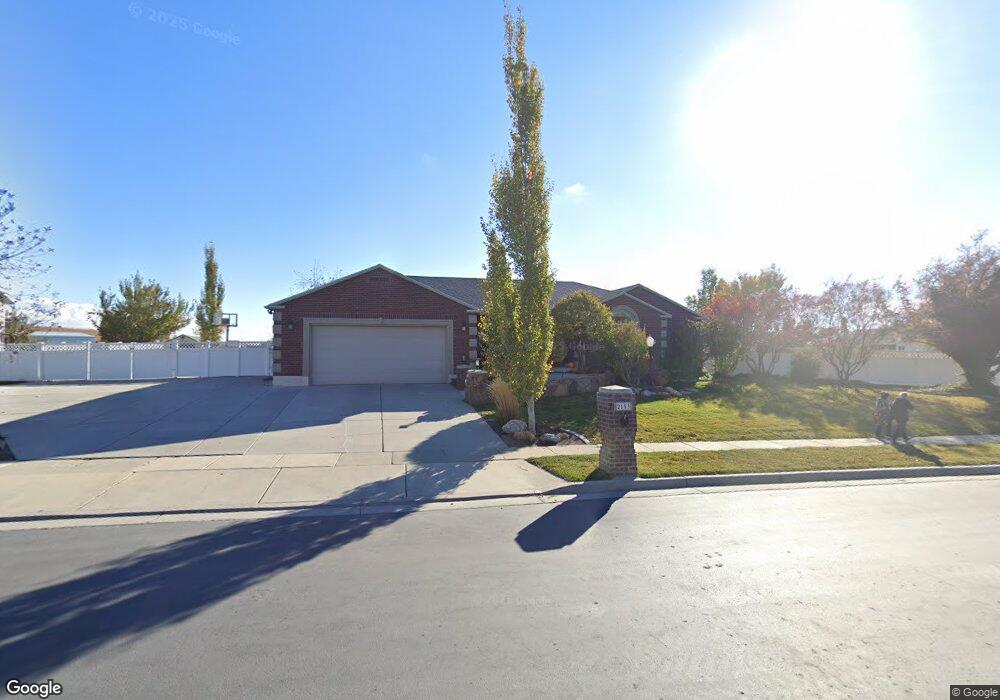
2153 W 1275 S Syracuse, UT 84075
Estimated Value: $563,000 - $741,000
3
Beds
3
Baths
1,702
Sq Ft
$388/Sq Ft
Est. Value
About This Home
This home is located at 2153 W 1275 S, Syracuse, UT 84075 and is currently estimated at $660,351, approximately $387 per square foot. 2153 W 1275 S is a home located in Davis County with nearby schools including Syracuse Elementary School, Syracuse Junior High School, and Syracuse High School.
Ownership History
Date
Name
Owned For
Owner Type
Purchase Details
Closed on
Jun 3, 2004
Sold by
Longfellow Holding Llc
Bought by
Tann Gary A and Tann Gina N
Current Estimated Value
Home Financials for this Owner
Home Financials are based on the most recent Mortgage that was taken out on this home.
Original Mortgage
$186,400
Interest Rate
5.92%
Mortgage Type
Purchase Money Mortgage
Purchase Details
Closed on
Jan 18, 2002
Sold by
Longfellow David R and Longfellow Vanessa
Bought by
Longfellow Holding Llc
Home Financials for this Owner
Home Financials are based on the most recent Mortgage that was taken out on this home.
Original Mortgage
$179,250
Interest Rate
2.75%
Purchase Details
Closed on
Jul 5, 2001
Sold by
Benchmark Real Estate Company
Bought by
Longfellow David and David Longfellow Construction
Create a Home Valuation Report for This Property
The Home Valuation Report is an in-depth analysis detailing your home's value as well as a comparison with similar homes in the area
Home Values in the Area
Average Home Value in this Area
Purchase History
| Date | Buyer | Sale Price | Title Company |
|---|---|---|---|
| Tann Gary A | -- | Bonneville Title Company Inc | |
| Longfellow Holding Llc | -- | Bonneville Title Company Inc | |
| Longfellow David R | -- | Bonneville Title Company Inc | |
| Longfellow David | -- | Founders Title Co |
Source: Public Records
Mortgage History
| Date | Status | Borrower | Loan Amount |
|---|---|---|---|
| Closed | Tann Gary A | $186,400 | |
| Previous Owner | Longfellow David R | $179,250 |
Source: Public Records
Tax History Compared to Growth
Tax History
| Year | Tax Paid | Tax Assessment Tax Assessment Total Assessment is a certain percentage of the fair market value that is determined by local assessors to be the total taxable value of land and additions on the property. | Land | Improvement |
|---|---|---|---|---|
| 2025 | $3,312 | $319,550 | $132,288 | $187,262 |
| 2024 | $3,312 | $321,750 | $116,811 | $204,939 |
| 2023 | $3,130 | $554,000 | $162,325 | $391,675 |
| 2022 | $3,282 | $318,450 | $92,399 | $226,051 |
| 2021 | $2,929 | $440,000 | $137,405 | $302,595 |
| 2020 | $2,648 | $385,000 | $115,946 | $269,054 |
| 2019 | $2,584 | $371,000 | $117,933 | $253,067 |
| 2018 | $2,428 | $346,000 | $111,404 | $234,596 |
| 2016 | $2,229 | $166,595 | $42,591 | $124,004 |
| 2015 | $2,279 | $162,195 | $42,591 | $119,604 |
| 2014 | $2,093 | $151,784 | $42,591 | $109,193 |
| 2013 | -- | $144,231 | $36,447 | $107,784 |
Source: Public Records
Map
Nearby Homes
- 2117 W 1275 S
- 2655 S 2430 W Unit 120
- 2665 S 2430 W Unit 118
- 2655 S 2430 W Unit 116
- 2633 S 2430 W Unit 113
- 2614 S 2430 W Unit 106
- 2663 S 2430 W
- 1641 S 2350 W Unit B
- 1466 Earl Cir
- 4344 W 1825 S Unit 102
- 4354 W 1825 S Unit 104
- 4348 W 1825 S Unit 103
- 1327 S 1650 W
- 1251 S 1650 W
- 2000 Farmhouse Plan at Legacy Park - Collection
- 2000 Farmhouse Select Plan at Legacy Park - Collection
- San Marino Craftsman Plan at Legacy Park - Estates
- 2050 Craftsman Plan at Legacy Park - Collection
- 1825 Farmhouse Plan at Legacy Park - Collection
- 2200 Garden Plan at Legacy Park - Collection