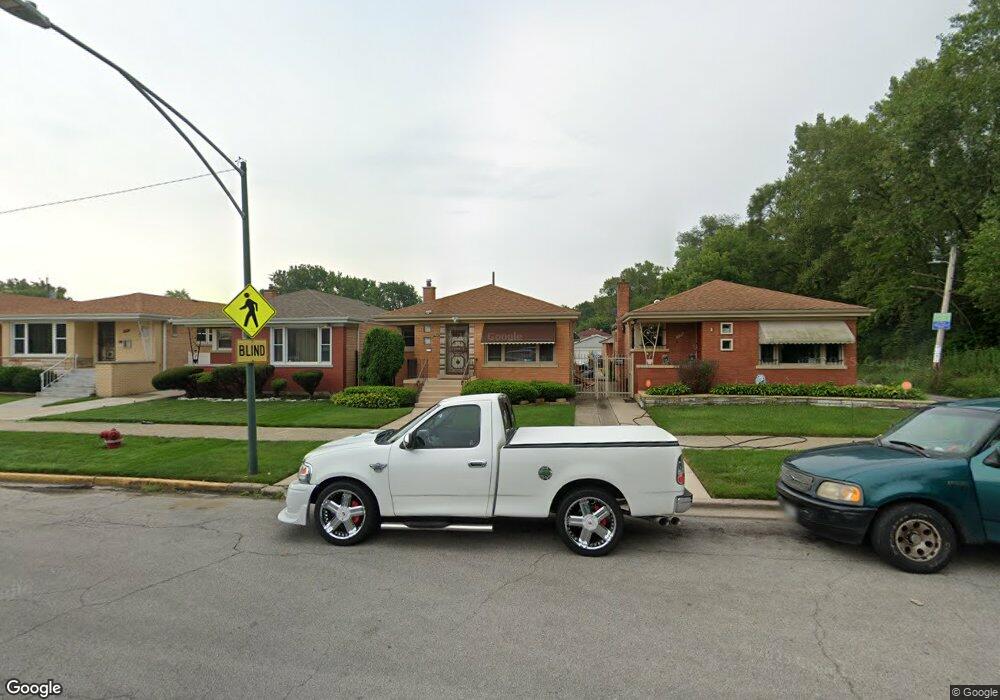
2153 W 82nd Place Chicago, IL 60620
Auburn Gresham NeighborhoodEstimated Value: $221,732 - $248,000
2
Beds
1
Bath
1,040
Sq Ft
$227/Sq Ft
Est. Value
About This Home
This home is located at 2153 W 82nd Place, Chicago, IL 60620 and is currently estimated at $236,183, approximately $227 per square foot. 2153 W 82nd Place is a home located in Cook County with nearby schools including Joplin Elementary School, Bogan Computer Technical High School, and LEARN Hunter Perkins.
Ownership History
Date
Name
Owned For
Owner Type
Purchase Details
Closed on
Nov 14, 2013
Sold by
Adeshina Adetunji and Adeshina Zena
Bought by
Adeshina Zena
Current Estimated Value
Purchase Details
Closed on
Aug 5, 2003
Sold by
Adeshina Zena
Bought by
Adeshina Adetunji and Adeshina Zena
Home Financials for this Owner
Home Financials are based on the most recent Mortgage that was taken out on this home.
Original Mortgage
$132,850
Outstanding Balance
$56,694
Interest Rate
5.31%
Mortgage Type
Unknown
Estimated Equity
$179,489
Purchase Details
Closed on
Jul 18, 2003
Sold by
Taylor Willie J and Taylor Ollie M
Bought by
Adeshina Zena
Home Financials for this Owner
Home Financials are based on the most recent Mortgage that was taken out on this home.
Original Mortgage
$132,850
Outstanding Balance
$56,694
Interest Rate
5.31%
Mortgage Type
Unknown
Estimated Equity
$179,489
Purchase Details
Closed on
Aug 26, 1998
Sold by
Taylor Ollie M
Bought by
Taylor Willie and Taylor Ollie M
Purchase Details
Closed on
Jul 10, 1998
Sold by
Taylor Willie and Taylor Ollie M
Bought by
Taylor Olliem
Create a Home Valuation Report for This Property
The Home Valuation Report is an in-depth analysis detailing your home's value as well as a comparison with similar homes in the area
Home Values in the Area
Average Home Value in this Area
Purchase History
| Date | Buyer | Sale Price | Title Company |
|---|---|---|---|
| Adeshina Zena | -- | None Available | |
| Adeshina Adetunji | -- | -- | |
| Adeshina Zena | $137,000 | Multiple | |
| Taylor Willie | -- | -- | |
| Taylor Olliem | -- | -- |
Source: Public Records
Mortgage History
| Date | Status | Borrower | Loan Amount |
|---|---|---|---|
| Open | Adeshina Zena | $132,850 | |
| Closed | Adeshina Zena | $2,500 |
Source: Public Records
Tax History Compared to Growth
Tax History
| Year | Tax Paid | Tax Assessment Tax Assessment Total Assessment is a certain percentage of the fair market value that is determined by local assessors to be the total taxable value of land and additions on the property. | Land | Improvement |
|---|---|---|---|---|
| 2024 | $2,241 | $12,001 | $2,113 | $9,888 |
| 2023 | $2,163 | $13,936 | $3,380 | $10,556 |
| 2022 | $2,163 | $13,936 | $3,380 | $10,556 |
| 2021 | $2,347 | $15,000 | $3,380 | $11,620 |
| 2020 | $1,319 | $9,022 | $3,380 | $5,642 |
| 2019 | $1,325 | $10,025 | $3,380 | $6,645 |
| 2018 | $1,302 | $10,025 | $3,380 | $6,645 |
| 2017 | $1,931 | $12,346 | $2,957 | $9,389 |
| 2016 | $1,973 | $12,346 | $2,957 | $9,389 |
| 2015 | $1,782 | $12,346 | $2,957 | $9,389 |
| 2014 | $1,649 | $11,456 | $2,746 | $8,710 |
| 2013 | $1,605 | $11,456 | $2,746 | $8,710 |
Source: Public Records
Map
Nearby Homes
- 2115 W 82nd Place
- 8333 S Hamilton Ave
- 2321 W 81st Place
- 8220 S Wolcott Ave
- 2418 W 83rd St
- 2028 W 80th St
- 2024 W 79th Place
- 8051 S Honore St
- 1752 W 83rd St
- 8012 S Honore St
- 8033 S Campbell Ave
- 1744 W 83rd St
- 8023 S Wood St
- 8357 S Hermitage Ave
- 7811 S Hoyne Ave
- 7828 S Winchester Ave
- 8119 S Paulina St
- 8242 S Marshfield Ave
- 8252 S Marshfield Ave
- 7928 S Hermitage Ave
- 2149 W 82nd Place
- 2155 W 82nd Place
- 2147 W 82nd Place
- 2143 W 82nd Place
- 2141 W 82nd Place
- 2152 W 83rd St
- 2150 W 83rd St
- 2148 W 83rd St
- 2144 W 83rd St
- 2137 W 82nd Place
- 2142 W 83rd St
- 2140 W 83rd St
- 2133 W 82nd Place
- 2138 W 83rd St
- 2136 W 83rd St
- 2129 W 82nd Place
- 2132 W 83rd St
- 2127 W 82nd Place
- 2126 W 83rd St
- 2126 W 83rd St