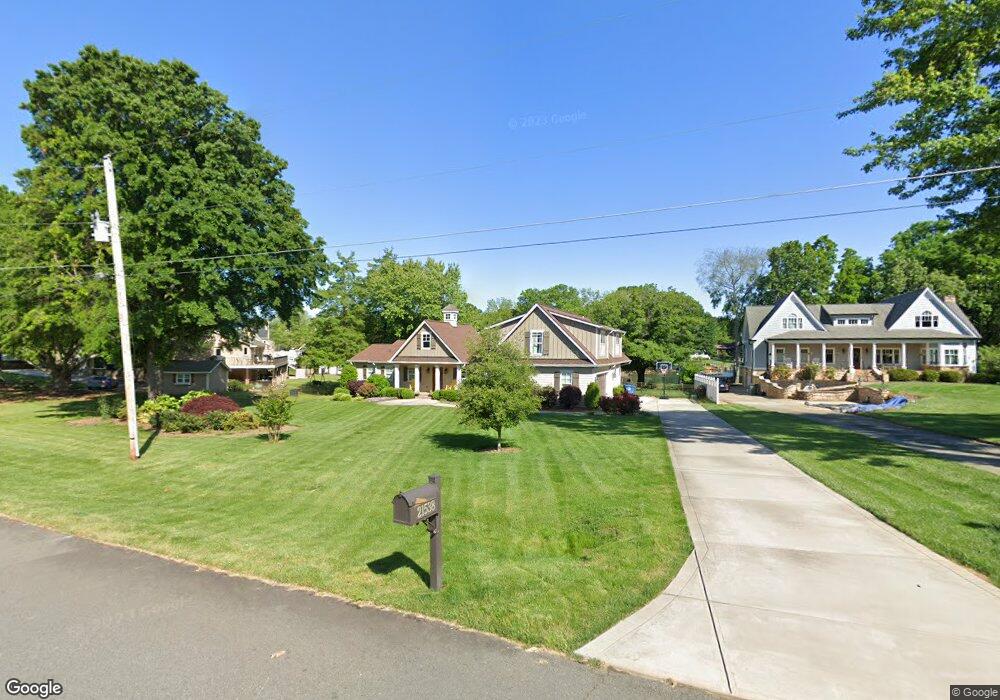
21538 Delftmere Dr Cornelius, NC 28031
Estimated Value: $1,136,000 - $1,658,000
3
Beds
2
Baths
2,000
Sq Ft
$735/Sq Ft
Est. Value
About This Home
This home is located at 21538 Delftmere Dr, Cornelius, NC 28031 and is currently estimated at $1,470,656, approximately $735 per square foot. 21538 Delftmere Dr is a home located in Mecklenburg County with nearby schools including Cornelius Elementary School, Bailey Middle School, and William Amos Hough High School.
Ownership History
Date
Name
Owned For
Owner Type
Purchase Details
Closed on
Dec 12, 2014
Sold by
Tefft Howard E and Tefft Carol A
Bought by
Reeder John and Reeder Emily
Current Estimated Value
Home Financials for this Owner
Home Financials are based on the most recent Mortgage that was taken out on this home.
Original Mortgage
$440,000
Outstanding Balance
$338,892
Interest Rate
4.07%
Mortgage Type
New Conventional
Estimated Equity
$1,131,764
Purchase Details
Closed on
Apr 28, 2000
Sold by
Wilson Carl A and Wilson Pat D
Bought by
Tefft Howard E and Tefft Carol A
Home Financials for this Owner
Home Financials are based on the most recent Mortgage that was taken out on this home.
Original Mortgage
$214,000
Interest Rate
8.24%
Purchase Details
Closed on
May 26, 1999
Sold by
White Don W and White Carole M
Bought by
Wilson Carl A
Create a Home Valuation Report for This Property
The Home Valuation Report is an in-depth analysis detailing your home's value as well as a comparison with similar homes in the area
Home Values in the Area
Average Home Value in this Area
Purchase History
| Date | Buyer | Sale Price | Title Company |
|---|---|---|---|
| Reeder John | $550,000 | None Available | |
| Tefft Howard E | $268,000 | -- | |
| Wilson Carl A | $230,000 | -- |
Source: Public Records
Mortgage History
| Date | Status | Borrower | Loan Amount |
|---|---|---|---|
| Open | Reeder John | $440,000 | |
| Previous Owner | Tefft Howard E | $214,000 | |
| Closed | Tefft Howard E | $24,500 |
Source: Public Records
Tax History Compared to Growth
Tax History
| Year | Tax Paid | Tax Assessment Tax Assessment Total Assessment is a certain percentage of the fair market value that is determined by local assessors to be the total taxable value of land and additions on the property. | Land | Improvement |
|---|---|---|---|---|
| 2025 | $8,081 | $1,224,000 | $660,000 | $564,000 |
| 2024 | $8,081 | $1,224,000 | $660,000 | $564,000 |
| 2023 | $7,954 | $1,224,000 | $660,000 | $564,000 |
| 2022 | $6,687 | $783,100 | $420,000 | $363,100 |
| 2021 | $6,609 | $783,100 | $420,000 | $363,100 |
| 2020 | $6,609 | $783,100 | $420,000 | $363,100 |
| 2019 | $6,603 | $783,100 | $420,000 | $363,100 |
| 2018 | $7,030 | $649,500 | $315,000 | $334,500 |
| 2017 | $6,978 | $649,500 | $315,000 | $334,500 |
| 2016 | $6,975 | $484,800 | $315,000 | $169,800 |
| 2015 | $5,135 | $484,800 | $315,000 | $169,800 |
| 2014 | $5,133 | $484,800 | $315,000 | $169,800 |
Source: Public Records
Map
Nearby Homes
- 21216 Norman Shores Dr
- 21528 Norman Shores Dr
- 21910 Torrence Chapel Rd
- 21907 Torrence Chapel Rd
- 20812 Decora Dr
- 907 Southwest Dr Unit 7
- 941 Southwest Dr Unit 41
- 21430 Blakely Shores Dr
- 22312 John Gamble Rd
- 854 Southwest Dr Unit 54
- 1018 Southwest Dr Unit 18
- 657 Portside Dr
- 719 Southwest Dr Unit 19
- 1238 Torrence Cir
- 725 Southwest Dr Unit 25
- 21208 Rio Oro Dr
- 21617 Rio Oro Dr
- 20615 Rio Oro Dr
- 1125 Torrence Cir Unit 67
- 765 Southwest Dr Unit 15
- 21524 Delftmere Dr
- 21540 Delftmere Dr
- 21516 Delftmere Dr
- 21304 Norman Shores Dr
- 21215 Captiva Ct
- 21220 Norman Shores Dr
- 21508 Delftmere Dr
- 21308 Norman Shores Dr
- 21225 Norman Shores Dr
- 21511 Delftmere Dr
- 21219 Norman Shores Dr
- 21318 Norman Shores Dr
- 21517 Delftmere Dr
- 21307 Norman Shores Dr
- 21202 Captiva Ct
- 21206 Captiva Ct
- 21500 Delftmere Dr
- 21507 Delftmere Dr
- 21311 Norman Shores Dr
- 21213 Norman Shores Dr