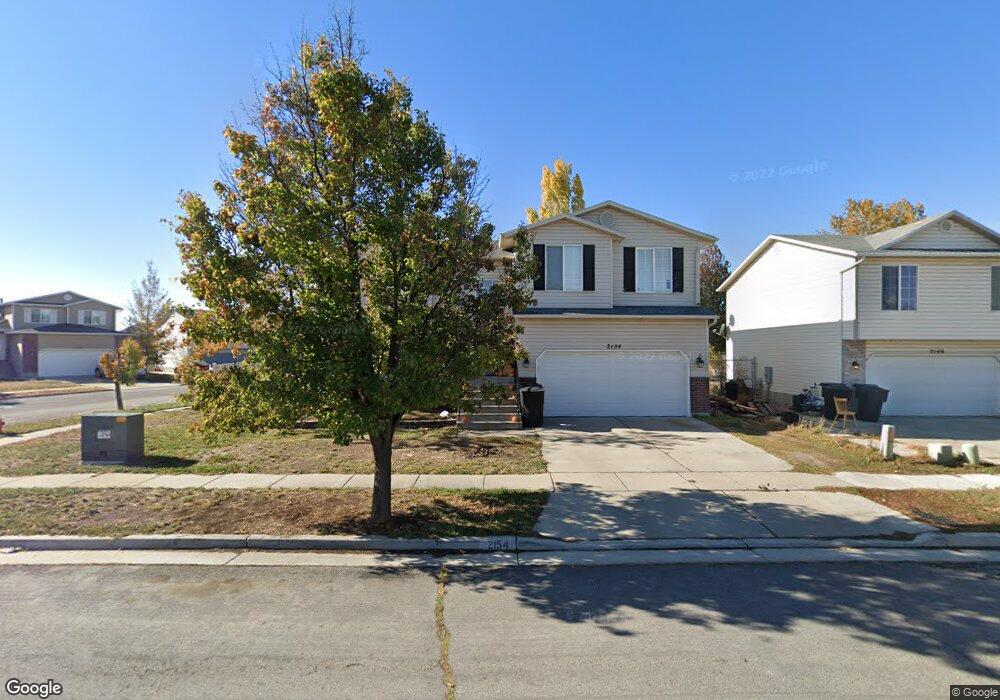
2154 Fremont Crest Ave Syracuse, UT 84075
Estimated Value: $425,000 - $466,000
4
Beds
3
Baths
1,658
Sq Ft
$273/Sq Ft
Est. Value
About This Home
This home is located at 2154 Fremont Crest Ave, Syracuse, UT 84075 and is currently estimated at $452,863, approximately $273 per square foot. 2154 Fremont Crest Ave is a home located in Davis County with nearby schools including Buffalo Point School, Syracuse Junior High School, and Syracuse High School.
Ownership History
Date
Name
Owned For
Owner Type
Purchase Details
Closed on
Jul 6, 2016
Sold by
Hover Jessie D
Bought by
Alten Ashley
Current Estimated Value
Purchase Details
Closed on
Jun 29, 2006
Sold by
Overby Kent A and Overby Molly M
Bought by
Hover Jessie D
Home Financials for this Owner
Home Financials are based on the most recent Mortgage that was taken out on this home.
Original Mortgage
$165,000
Interest Rate
6.62%
Mortgage Type
New Conventional
Purchase Details
Closed on
Sep 23, 2002
Sold by
Overby Kent A
Bought by
Overby Kent A and Overby Molly M
Purchase Details
Closed on
Sep 16, 2002
Sold by
Woodside Homes Corp
Bought by
Overby Kent A
Purchase Details
Closed on
Dec 21, 2001
Sold by
Pleasant Valley Investments Lc
Bought by
Woodside Homes Corp
Create a Home Valuation Report for This Property
The Home Valuation Report is an in-depth analysis detailing your home's value as well as a comparison with similar homes in the area
Home Values in the Area
Average Home Value in this Area
Purchase History
| Date | Buyer | Sale Price | Title Company |
|---|---|---|---|
| Alten Ashley | -- | -- | |
| Hover Jessie D | -- | Equity Title Ins Agency Inc | |
| Overby Kent A | -- | First American Title Co | |
| Overby Kent A | -- | First American Title Co | |
| Woodside Homes Corp | -- | First American Title Co |
Source: Public Records
Mortgage History
| Date | Status | Borrower | Loan Amount |
|---|---|---|---|
| Previous Owner | Hover Jessie D | $165,000 |
Source: Public Records
Tax History Compared to Growth
Tax History
| Year | Tax Paid | Tax Assessment Tax Assessment Total Assessment is a certain percentage of the fair market value that is determined by local assessors to be the total taxable value of land and additions on the property. | Land | Improvement |
|---|---|---|---|---|
| 2025 | $2,309 | $222,750 | $94,563 | $128,187 |
| 2024 | $2,322 | $225,500 | $69,350 | $156,150 |
| 2023 | $2,232 | $395,000 | $112,499 | $282,501 |
| 2022 | $2,381 | $231,000 | $52,823 | $178,177 |
| 2021 | $2,057 | $309,000 | $77,438 | $231,562 |
| 2020 | $1,815 | $264,000 | $58,776 | $205,224 |
| 2019 | $1,734 | $249,000 | $64,269 | $184,731 |
| 2018 | $1,607 | $229,000 | $63,751 | $165,249 |
| 2016 | $1,398 | $104,445 | $28,516 | $75,929 |
| 2015 | $1,393 | $99,165 | $28,516 | $70,649 |
| 2014 | $1,398 | $101,395 | $28,516 | $72,879 |
| 2013 | -- | $95,002 | $25,204 | $69,798 |
Source: Public Records
Map
Nearby Homes
- 2297 W 2175 S
- 2961 S 2425 W Unit 1123
- 2696 2495 S Unit 207
- 2524 S 3590 W Unit 602
- 2965 S 3000 W
- 2971 S 2425 W Unit 1124
- 2686 S 2440 W Unit 101
- 2635 S 2430 W Unit 114
- 3062 W Solace St
- 2237 Craig Ln
- 4344 W 1825 S Unit 102
- 4354 W 1825 S Unit 104
- 4348 W 1825 S Unit 103
- 2679 W Antelope Dr
- 2574 S 2430 W Unit 503
- 2982 S 3000 W
- 2912 S 3000 W
- 2136 W 2200 S
- 2455 S Bluff Rd
- 2104 W 2200 S
- 2146 Fremont Crest Ave
- 2154 S Fremont Crest Ave W
- 2674 W 2175 S
- 2136 S Fremont Crest Ave W
- 2136 Fremont Crest Ave
- 2649 W 2175 S
- 2143 Fremont Crest Ave
- 2153 Fremont Crest Ave
- 2661 W 2175 S
- 2133 Fremont Crest Ave
- 2126 Fremont Crest Ave
- 2161 Fremont Crest Ave
- 2671 W 2175 S
- 2692 W 2175 S
- 2123 Fremont Crest Ave
- 2123 S Fremont Ave W
- 2147 Lake Mesa Dr S
- 2123 Fremont Crest Ave
- 2683 W 2175 S
- 2171 Fremont Crest Ave