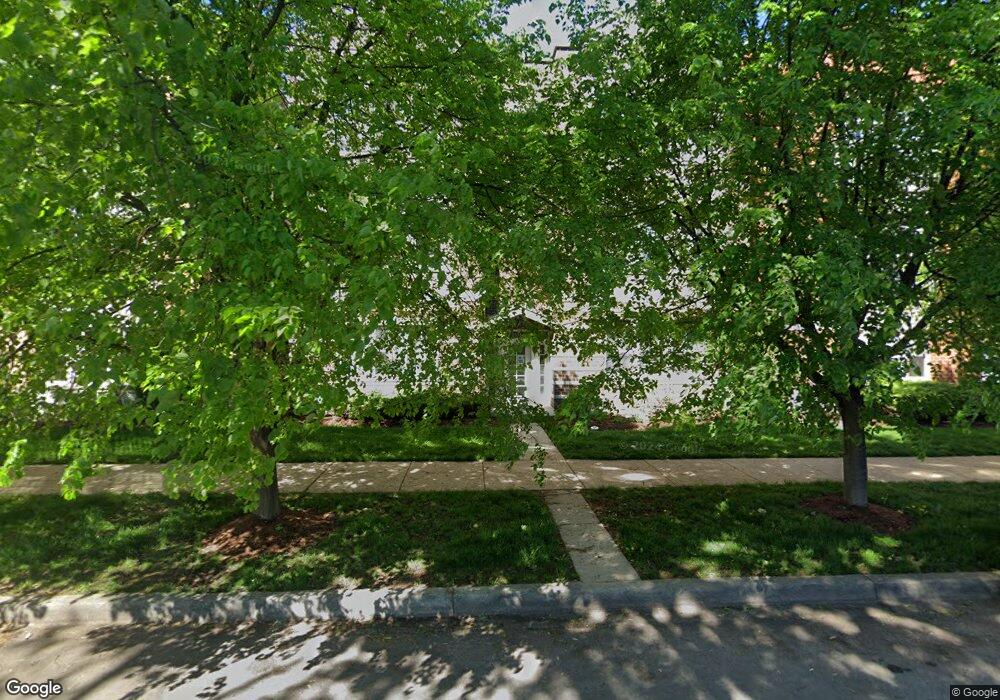
2154 N Natchez Ave Unit 2S Chicago, IL 60707
Galewood NeighborhoodEstimated Value: $268,000 - $300,000
2
Beds
2
Baths
1,325
Sq Ft
$212/Sq Ft
Est. Value
About This Home
This home is located at 2154 N Natchez Ave Unit 2S, Chicago, IL 60707 and is currently estimated at $281,432, approximately $212 per square foot. 2154 N Natchez Ave Unit 2S is a home located in Cook County with nearby schools including Burbank Elementary School, Steinmetz College Prep, and Acero - Roberto Clemente Elementary School.
Ownership History
Date
Name
Owned For
Owner Type
Purchase Details
Closed on
Jan 14, 2013
Sold by
Us Bank Na
Bought by
Negron Jeanette
Current Estimated Value
Home Financials for this Owner
Home Financials are based on the most recent Mortgage that was taken out on this home.
Original Mortgage
$67,175
Interest Rate
3.46%
Mortgage Type
FHA
Purchase Details
Closed on
Aug 8, 2012
Sold by
Mesa Vanessa
Bought by
Us Bank Na
Purchase Details
Closed on
Feb 15, 2007
Sold by
Mendoza Joe and Mendoza Maria
Bought by
Mesa Mauricio and Mesa Vanessa
Home Financials for this Owner
Home Financials are based on the most recent Mortgage that was taken out on this home.
Original Mortgage
$234,175
Interest Rate
8%
Mortgage Type
Unknown
Create a Home Valuation Report for This Property
The Home Valuation Report is an in-depth analysis detailing your home's value as well as a comparison with similar homes in the area
Home Values in the Area
Average Home Value in this Area
Purchase History
| Date | Buyer | Sale Price | Title Company |
|---|---|---|---|
| Negron Jeanette | $86,500 | Fidelity National Title Insu | |
| Us Bank Na | -- | None Available | |
| Mesa Mauricio | $246,500 | Heritage Title Company |
Source: Public Records
Mortgage History
| Date | Status | Borrower | Loan Amount |
|---|---|---|---|
| Previous Owner | Negron Jeanette | $67,175 | |
| Previous Owner | Mesa Mauricio | $234,175 |
Source: Public Records
Tax History Compared to Growth
Tax History
| Year | Tax Paid | Tax Assessment Tax Assessment Total Assessment is a certain percentage of the fair market value that is determined by local assessors to be the total taxable value of land and additions on the property. | Land | Improvement |
|---|---|---|---|---|
| 2024 | $3,098 | $26,100 | $4,098 | $22,002 |
| 2023 | $2,999 | $18,000 | $3,305 | $14,695 |
| 2022 | $2,999 | $18,000 | $3,305 | $14,695 |
| 2021 | $2,950 | $17,999 | $3,304 | $14,695 |
| 2020 | $2,935 | $16,279 | $1,652 | $14,627 |
| 2019 | $2,988 | $18,299 | $1,652 | $16,647 |
| 2018 | $2,936 | $18,299 | $1,652 | $16,647 |
| 2017 | $2,000 | $12,666 | $1,454 | $11,212 |
| 2016 | $2,037 | $12,666 | $1,454 | $11,212 |
| 2015 | $1,840 | $12,666 | $1,454 | $11,212 |
| 2014 | $3,871 | $20,862 | $1,387 | $19,475 |
| 2013 | $3,316 | $20,862 | $1,387 | $19,475 |
Source: Public Records
Map
Nearby Homes
- 2311 N Natchez Ave
- 2044 N Narragansett Ave
- 2317 N Natchez Ave
- 2328 N Normandy Ave
- 1937 N Normandy Ave
- 2048 N Oak Park Ave
- 2335 N Merrimac Ave
- 2430 N Normandy Ave
- 1916 N Rutherford Ave
- 1941 N New England Ave
- 2119 N Mcvicker Ave
- 1700 N Natoma Ave
- 1733 N Oak Park Ave
- 2554 N Oak Park Ave
- 2123 N Austin Ave
- 1627 N Narragansett Ave
- 2612 N Moody Ave
- 2601 N Moody Ave
- 7036 W Belden Ave
- 2724 N Mobile Ave
- 2154 N Natchez Ave Unit 1S
- 2154 N Natchez Ave Unit 3S
- 2154 N Natchez Ave Unit 1N
- 2154 N Natchez Ave Unit 3N
- 2154 N Natchez Ave Unit 2N
- 2150 N Natchez Ave Unit 1N
- 2150 N Natchez Ave Unit 3N
- 2150 N Natchez Ave Unit 3S
- 2150 N Natchez Ave Unit 1S
- 2150 N Natchez Ave Unit 2S
- 2146 N Natchez Ave Unit 2N
- 2146 N Natchez Ave Unit 3N
- 2146 N Natchez Ave Unit 2S
- 2146 N Natchez Ave Unit 1S
- 2146 N Natchez Ave Unit 3S
- 2146 N Natchez Ave Unit 1N
- 2142 N Natchez Ave Unit 3S
- 2142 N Natchez Ave Unit 2S
- 2142 N Natchez Ave Unit 2N
- 2142 N Natchez Ave Unit 1S