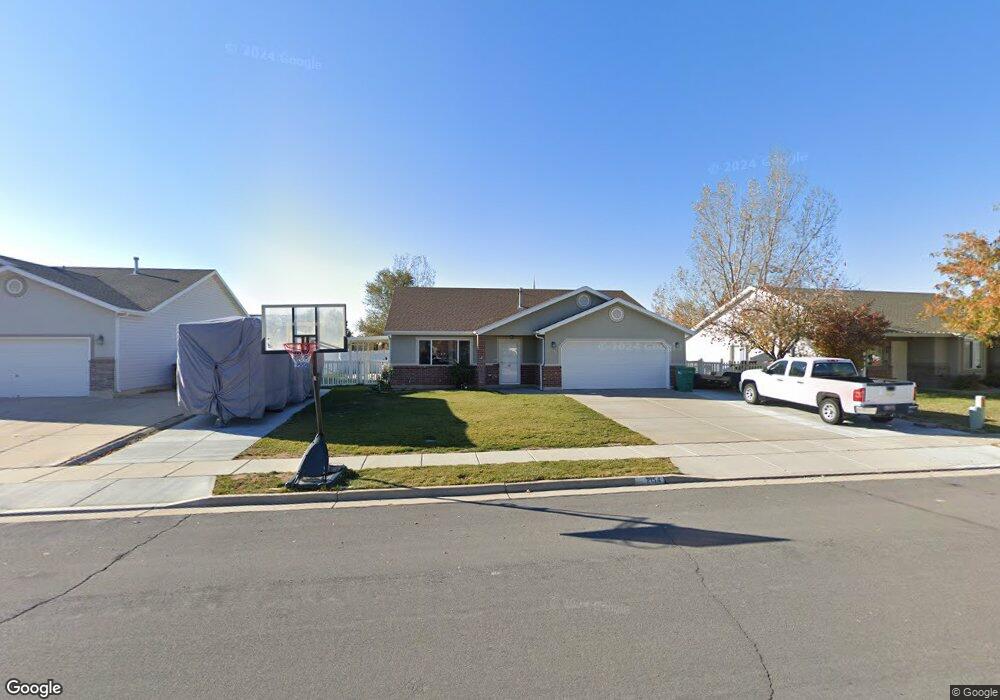
2154 S 825 E Clearfield, UT 84015
Estimated Value: $463,681 - $478,000
3
Beds
2
Baths
1,533
Sq Ft
$307/Sq Ft
Est. Value
About This Home
This home is located at 2154 S 825 E, Clearfield, UT 84015 and is currently estimated at $470,920, approximately $307 per square foot. 2154 S 825 E is a home located in Davis County with nearby schools including Antelope Elementary School, North Davis Junior High School, and Clearfield High School.
Ownership History
Date
Name
Owned For
Owner Type
Purchase Details
Closed on
May 6, 2021
Sold by
Kridit Investments Llc
Bought by
Imes Randy and Imes Lori
Current Estimated Value
Purchase Details
Closed on
Apr 12, 2021
Sold by
Kridit Investments Llc
Bought by
Loewen Daniel A
Purchase Details
Closed on
Jan 30, 2004
Sold by
Hertzke John T and Hertzke Marie A
Bought by
Hertzke John J and Hertzke Marie A
Purchase Details
Closed on
Aug 21, 2002
Sold by
Symphony Development Corp
Bought by
U S Development Inc
Purchase Details
Closed on
Jan 29, 2002
Sold by
Aspen Homes Development Inc
Bought by
Hertzke John T and Hertzke Marie A
Home Financials for this Owner
Home Financials are based on the most recent Mortgage that was taken out on this home.
Original Mortgage
$109,472
Interest Rate
4.37%
Create a Home Valuation Report for This Property
The Home Valuation Report is an in-depth analysis detailing your home's value as well as a comparison with similar homes in the area
Home Values in the Area
Average Home Value in this Area
Purchase History
| Date | Buyer | Sale Price | Title Company |
|---|---|---|---|
| Imes Randy | -- | Aspen Title Insuranc | |
| Loewen Daniel A | -- | Aspen Title Insurance | |
| Krjdit Investments Llc | -- | Aspen Title Insurance Agency | |
| Hertzke John J | -- | Mountain View Title & Escrow | |
| U S Development Inc | -- | Bonneville Title Company Inc | |
| Aspen Homes Development Inc | -- | Bonneville Title Company Inc | |
| Hertzke John T | -- | Mountain View Title & Escrow |
Source: Public Records
Mortgage History
| Date | Status | Borrower | Loan Amount |
|---|---|---|---|
| Previous Owner | Hertzke John T | $109,472 |
Source: Public Records
Tax History
| Year | Tax Paid | Tax Assessment Tax Assessment Total Assessment is a certain percentage of the fair market value that is determined by local assessors to be the total taxable value of land and additions on the property. | Land | Improvement |
|---|---|---|---|---|
| 2025 | $2,522 | $226,050 | $72,093 | $153,957 |
| 2024 | $2,449 | $221,100 | $68,925 | $152,175 |
| 2023 | $2,251 | $373,000 | $110,323 | $262,677 |
| 2022 | $2,547 | $228,250 | $63,209 | $165,041 |
| 2021 | $2,341 | $317,000 | $67,057 | $249,943 |
| 2020 | $2,030 | $273,000 | $56,367 | $216,633 |
| 2019 | $1,974 | $262,000 | $59,172 | $202,828 |
| 2018 | $1,467 | $237,000 | $52,521 | $184,479 |
| 2016 | $1,227 | $108,295 | $20,970 | $87,325 |
| 2015 | $1,566 | $100,925 | $20,970 | $79,955 |
| 2014 | $1,219 | $104,430 | $20,970 | $83,460 |
| 2013 | -- | $98,173 | $29,480 | $68,693 |
Source: Public Records
Map
Nearby Homes
- 906 E Sam Cir
- 1876 W 1575 N Unit 237
- 1570 N 1875 W Unit 242
- 1570 N 1875 W
- 1969 S 575 E
- 1558 N 1875 W
- 1558 N 1875 W Unit 245
- 1877 S 725 E
- 1186 N 2425 W
- 1491 N 1875 W
- 1487 N 1875 W
- 1487 N 1875 W Unit 159
- 1483 N 1875 W
- 1479 N 1875 W
- 1479 N 1875 W Unit 161
- 1471 N 1875 W
- 1471 N 1875 W Unit 163
- 1870 N Celia Way
- 1452 N 1875 W Unit 146
- 1451 N 1875 W Unit 168
Your Personal Tour Guide
Ask me questions while you tour the home.