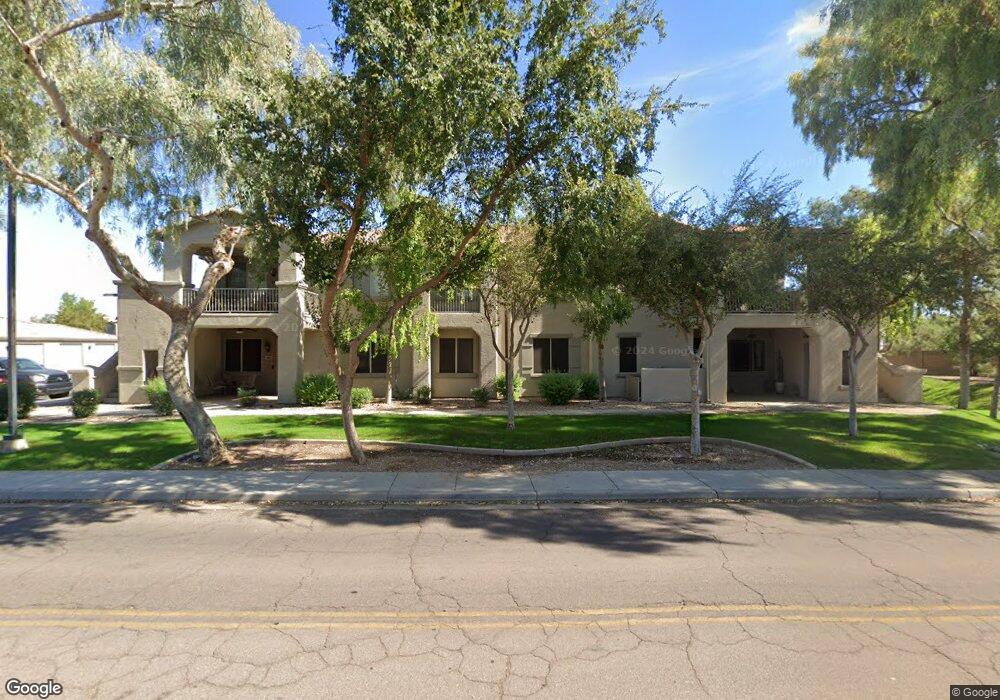
2155 N Grace Blvd Unit 207 Chandler, AZ 85225
Amberwood NeighborhoodEstimated Value: $290,718 - $318,000
2
Beds
2
Baths
1,165
Sq Ft
$266/Sq Ft
Est. Value
About This Home
This home is located at 2155 N Grace Blvd Unit 207, Chandler, AZ 85225 and is currently estimated at $310,180, approximately $266 per square foot. 2155 N Grace Blvd Unit 207 is a home located in Maricopa County with nearby schools including Sirrine Elementary School, Franklin at Brimhall Elementary School, and Summit Academy Elementary.
Ownership History
Date
Name
Owned For
Owner Type
Purchase Details
Closed on
Sep 7, 2023
Sold by
Wong Stan and Wong Carolyn
Bought by
Wong Living Trust and Wong
Current Estimated Value
Purchase Details
Closed on
Jun 2, 2005
Sold by
Pomponio Darren and Pomponio Megan
Bought by
Wong Stan and Wong Carolyn
Home Financials for this Owner
Home Financials are based on the most recent Mortgage that was taken out on this home.
Original Mortgage
$136,500
Interest Rate
5.65%
Mortgage Type
New Conventional
Purchase Details
Closed on
Sep 21, 2004
Sold by
Mirage Manor Llc
Bought by
Pomponio Darren and Pomponio Megan
Home Financials for this Owner
Home Financials are based on the most recent Mortgage that was taken out on this home.
Original Mortgage
$137,700
Interest Rate
6.25%
Mortgage Type
New Conventional
Create a Home Valuation Report for This Property
The Home Valuation Report is an in-depth analysis detailing your home's value as well as a comparison with similar homes in the area
Home Values in the Area
Average Home Value in this Area
Purchase History
| Date | Buyer | Sale Price | Title Company |
|---|---|---|---|
| Wong Living Trust | -- | None Listed On Document | |
| Wong Stan | $210,000 | Guaranty Title Agency | |
| Pomponio Darren | $172,150 | First American Title Ins Co |
Source: Public Records
Mortgage History
| Date | Status | Borrower | Loan Amount |
|---|---|---|---|
| Previous Owner | Wong Stan | $136,500 | |
| Previous Owner | Pomponio Darren | $137,700 | |
| Closed | Pomponio Darren | $17,235 |
Source: Public Records
Tax History Compared to Growth
Tax History
| Year | Tax Paid | Tax Assessment Tax Assessment Total Assessment is a certain percentage of the fair market value that is determined by local assessors to be the total taxable value of land and additions on the property. | Land | Improvement |
|---|---|---|---|---|
| 2025 | $1,110 | $11,006 | -- | -- |
| 2024 | $1,113 | $10,482 | -- | -- |
| 2023 | $1,113 | $21,610 | $4,320 | $17,290 |
| 2022 | $1,084 | $17,570 | $3,510 | $14,060 |
| 2021 | $1,078 | $16,150 | $3,230 | $12,920 |
| 2020 | $1,066 | $14,520 | $2,900 | $11,620 |
| 2019 | $991 | $13,150 | $2,630 | $10,520 |
| 2018 | $965 | $12,070 | $2,410 | $9,660 |
| 2017 | $930 | $10,830 | $2,160 | $8,670 |
| 2016 | $771 | $10,520 | $2,100 | $8,420 |
| 2015 | $725 | $9,920 | $1,980 | $7,940 |
Source: Public Records
Map
Nearby Homes
- 2155 N Grace Blvd Unit 213
- 2155 N Grace Blvd Unit 202
- 2155 N Grace Blvd Unit 214
- 307 W El Prado Rd
- 286 W Palomino Dr Unit 99
- 286 W Palomino Dr Unit 147
- 1970 N Hartford St Unit 84
- 1970 N Hartford St Unit 88
- 1961 N Hartford St Unit 1055
- 1961 N Hartford St Unit 1092
- 305 W Nopal Place
- 1955 N Illinois St
- 792 W El Monte Place Unit 8
- 638 W Barrow Dr
- 731 W Palomino Dr
- 555 W Warner Rd Unit 139
- 555 W Warner Rd Unit 127
- 555 W Warner Rd Unit 11
- 555 W Warner Rd Unit 156
- 2603 N Hartford St
- 2155 N Grace Blvd Unit 107
- 2155 N Grace Blvd Unit 204
- 2155 N Grace Blvd Unit 222
- 2155 N Grace Blvd Unit 106
- 2155 N Grace Blvd
- 2155 N Grace Blvd Unit 119
- 2155 N Grace Blvd Unit 212
- 2155 N Grace Blvd Unit 102
- 2155 N Grace Blvd Unit 127
- 2155 N Grace Blvd Unit 123
- 2155 N Grace Blvd Unit 206
- 2155 N Grace Blvd Unit 226
- 2155 N Grace Blvd Unit 108
- 2155 N Grace Blvd Unit 217
- 2155 N Grace Blvd Unit 216
- 2155 N Grace Blvd Unit 218
- 2155 N Grace Blvd Unit 219
- 2155 N Grace Blvd Unit 120
- 2155 N Grace Blvd Unit 110
- 2155 N Grace Blvd Unit 225