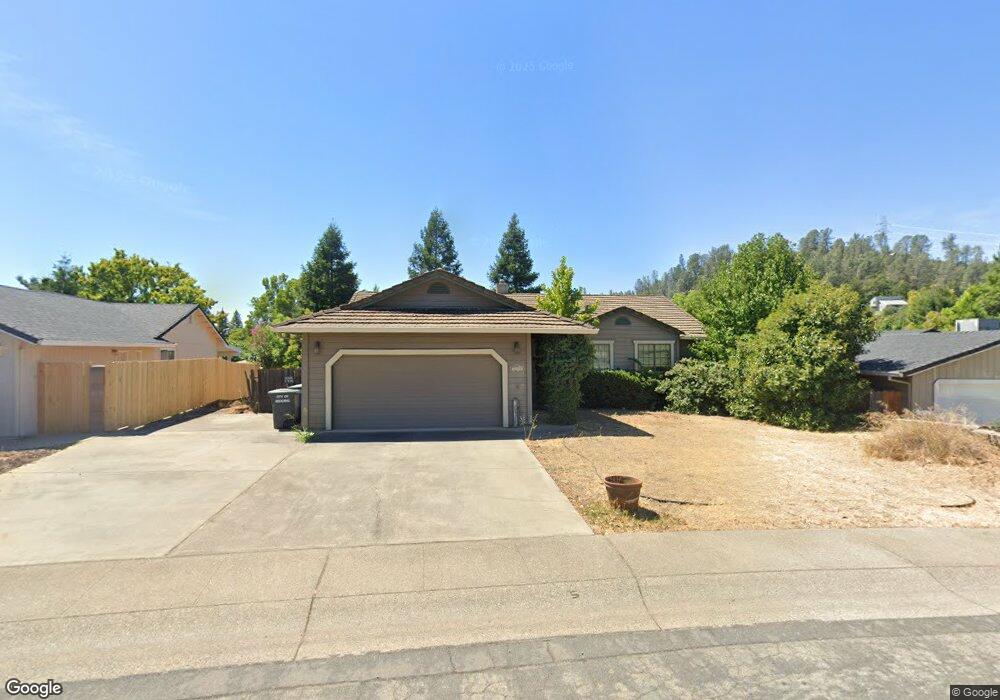
2155 Wicklow St Redding, CA 96001
Mary Lake NeighborhoodEstimated Value: $364,299 - $444,000
3
Beds
2
Baths
1,577
Sq Ft
$253/Sq Ft
Est. Value
About This Home
This home is located at 2155 Wicklow St, Redding, CA 96001 and is currently estimated at $399,575, approximately $253 per square foot. 2155 Wicklow St is a home located in Shasta County with nearby schools including Manzanita Elementary School, Sequoia Middle School, and Shasta High School.
Ownership History
Date
Name
Owned For
Owner Type
Purchase Details
Closed on
Jun 24, 2022
Sold by
Larsen Shelley E
Bought by
Shelley Elizabeth Larsen Living Trust
Current Estimated Value
Purchase Details
Closed on
Feb 6, 2002
Sold by
Dean Evon and Tang Evon
Bought by
Larsen Shelley E
Home Financials for this Owner
Home Financials are based on the most recent Mortgage that was taken out on this home.
Original Mortgage
$150,636
Interest Rate
6.94%
Mortgage Type
FHA
Purchase Details
Closed on
Sep 18, 1998
Sold by
Tang Sparrow
Bought by
Tang Evon
Home Financials for this Owner
Home Financials are based on the most recent Mortgage that was taken out on this home.
Original Mortgage
$102,817
Interest Rate
6.88%
Mortgage Type
FHA
Purchase Details
Closed on
Mar 11, 1997
Sold by
Prose Ronald L
Bought by
Tang Sparrow and Tang Evon
Home Financials for this Owner
Home Financials are based on the most recent Mortgage that was taken out on this home.
Original Mortgage
$102,311
Interest Rate
7.9%
Mortgage Type
FHA
Create a Home Valuation Report for This Property
The Home Valuation Report is an in-depth analysis detailing your home's value as well as a comparison with similar homes in the area
Home Values in the Area
Average Home Value in this Area
Purchase History
| Date | Buyer | Sale Price | Title Company |
|---|---|---|---|
| Shelley Elizabeth Larsen Living Trust | -- | Douglas Wright Law Apc | |
| Larsen Shelley E | $153,000 | Fidelity National Title Co | |
| Tang Evon | -- | Fidelity National Title Co | |
| Tang Sparrow | $103,000 | Fidelity National Title Co |
Source: Public Records
Mortgage History
| Date | Status | Borrower | Loan Amount |
|---|---|---|---|
| Previous Owner | Larsen Shelley E | $150,636 | |
| Previous Owner | Tang Evon | $102,817 | |
| Previous Owner | Tang Sparrow | $102,311 | |
| Closed | Larsen Shelley E | $9,180 |
Source: Public Records
Tax History
| Year | Tax Paid | Tax Assessment Tax Assessment Total Assessment is a certain percentage of the fair market value that is determined by local assessors to be the total taxable value of land and additions on the property. | Land | Improvement |
|---|---|---|---|---|
| 2025 | $5,589 | $226,003 | $51,691 | $174,312 |
| 2024 | $5,553 | $221,573 | $50,678 | $170,895 |
| 2023 | $5,553 | $217,230 | $49,685 | $167,545 |
| 2022 | $5,503 | $212,971 | $48,711 | $164,260 |
| 2021 | $5,491 | $208,796 | $47,756 | $161,040 |
| 2020 | $5,519 | $206,656 | $47,267 | $159,389 |
| 2019 | $5,405 | $202,605 | $46,341 | $156,264 |
| 2018 | $5,423 | $198,633 | $45,433 | $153,200 |
| 2017 | $2,110 | $194,740 | $44,543 | $150,197 |
| 2016 | $2,041 | $190,922 | $43,670 | $147,252 |
| 2015 | $2,014 | $188,056 | $43,015 | $145,041 |
| 2014 | $1,999 | $184,373 | $42,173 | $142,200 |
Source: Public Records
Map
Nearby Homes
- 1783 Record Ln
- 4519 Nantucket Dr
- 1974 Kildare Dr
- 1756 Mary Lake Dr
- 1846 Kildare Dr
- 4125 Oro St
- 4746 Tralee Ln
- 1695 Kildare Dr
- 4160 Travona Ct
- 4065 Meander Dr
- 1692 Kildare Dr
- 16928 Campo Calle
- 3882 Fujiyama Way
- 2242 Everest Dr
- 0 Thompson Ln
- 1513 Brinn Dr
- 2358 Cumberland Dr
- 4648 Kilkee Dr
- 1426 Gladstone Ct
- 16520 Blarney Ln
- 2177 Wicklow St
- 2133 Wicklow St
- 2175 Oconner Ave
- 2175 Oconnor
- 2175 O'Conner
- 2199 Wicklow St
- 2111 Wicklow St
- 1722 Record Ln
- 1728 Record Ln
- 2144 Wicklow St
- 2098 Imelda Ct
- 1710 Record Ln
- 2105 Wicklow St
- 1740 Record Ln
- 4997 Tralee Ln
- 2188 Wicklow St
- 9 Wicklow St
- 0 Wicklow St
- 10 Wicklow St
- 2210 Oconner Ave
Your Personal Tour Guide
Ask me questions while you tour the home.