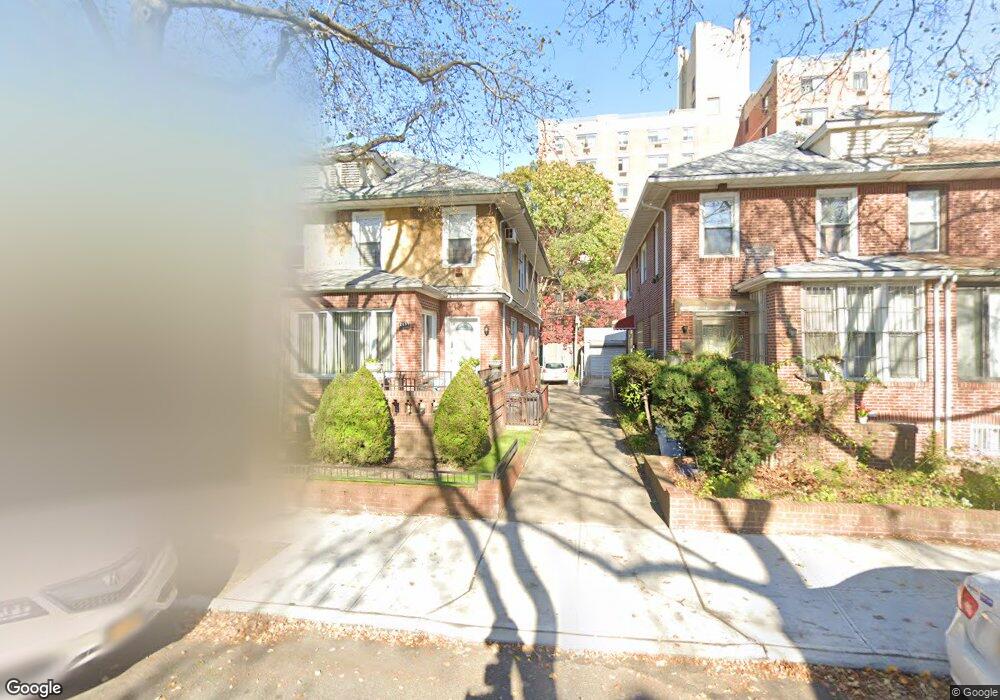
2157 79th St Brooklyn, NY 11214
Bensonhurst NeighborhoodEstimated Value: $1,226,000 - $1,299,000
Studio
--
Bath
1,632
Sq Ft
$765/Sq Ft
Est. Value
About This Home
This home is located at 2157 79th St, Brooklyn, NY 11214 and is currently estimated at $1,248,821, approximately $765 per square foot. 2157 79th St is a home located in Kings County with nearby schools including P.S. 128K BENSONHURST, Seth Low Intermediate School 96, and James Madison High School.
Ownership History
Date
Name
Owned For
Owner Type
Purchase Details
Closed on
Jan 8, 2025
Sold by
Rl 4-15 Trust and Uri L Gartenhaus Trustee
Bought by
Rl 4-15 Trust and Uri L Gartenhaus Trustee
Current Estimated Value
Purchase Details
Closed on
May 10, 2015
Sold by
Schiff Emanuel
Bought by
Rl 4-15 Trust and Uri L Gartenhaus As Trustee
Purchase Details
Closed on
Apr 16, 1997
Sold by
Federal Home Loan Mortgage Corporation
Bought by
The Chase Manhattan Bank Na
Home Financials for this Owner
Home Financials are based on the most recent Mortgage that was taken out on this home.
Original Mortgage
$121,500
Interest Rate
7.98%
Purchase Details
Closed on
Apr 7, 1997
Sold by
The Chase Manhattan Bank Na
Bought by
Schiff Emanuel
Home Financials for this Owner
Home Financials are based on the most recent Mortgage that was taken out on this home.
Original Mortgage
$121,500
Interest Rate
7.98%
Create a Home Valuation Report for This Property
The Home Valuation Report is an in-depth analysis detailing your home's value as well as a comparison with similar homes in the area
Home Values in the Area
Average Home Value in this Area
Purchase History
| Date | Buyer | Sale Price | Title Company |
|---|---|---|---|
| Rl 4-15 Trust | -- | -- | |
| Rl 4-15 Trust | -- | -- | |
| Rl 4-15 Trust | -- | -- | |
| Rl 4-15 Trust | -- | -- | |
| Rl 4-15 Trust | -- | -- | |
| The Chase Manhattan Bank Na | -- | -- | |
| The Chase Manhattan Bank Na | -- | -- | |
| Schiff Emanuel | $210,000 | -- | |
| Schiff Emanuel | $210,000 | -- |
Source: Public Records
Mortgage History
| Date | Status | Borrower | Loan Amount |
|---|---|---|---|
| Previous Owner | Schiff Emanuel | $121,500 |
Source: Public Records
Tax History
| Year | Tax Paid | Tax Assessment Tax Assessment Total Assessment is a certain percentage of the fair market value that is determined by local assessors to be the total taxable value of land and additions on the property. | Land | Improvement |
|---|---|---|---|---|
| 2025 | $8,955 | $75,360 | $13,740 | $61,620 |
| 2024 | $8,955 | $63,420 | $13,740 | $49,680 |
| 2023 | $8,570 | $69,600 | $13,740 | $55,860 |
| 2022 | $8,068 | $68,220 | $13,740 | $54,480 |
| 2021 | $8,052 | $66,120 | $13,740 | $52,380 |
| 2019 | $7,773 | $64,980 | $13,740 | $51,240 |
| 2018 | $7,169 | $35,167 | $9,257 | $25,910 |
| 2017 | $6,865 | $33,679 | $9,545 | $24,134 |
| 2016 | $6,374 | $31,886 | $9,162 | $22,724 |
| 2015 | $3,832 | $31,874 | $10,911 | $20,963 |
| 2014 | $3,832 | $30,964 | $12,726 | $18,238 |
Source: Public Records
Map
Nearby Homes
- 2150 80th St
- 7819 Bay Pkwy Unit PH
- 7913 Bay Pkwy Unit D7
- 2125 77th St
- 2172 76th St
- 7608 Bay Pkwy Unit 5C
- 7608 Bay Pkwy Unit 8C
- 2152 81st St Unit 2A
- 10 Avenue P Unit 5D
- 92 Kings Hwy
- 8100 Bay Pkwy Unit 4E
- 2155 82nd St Unit 3J
- 2155 82nd St Unit 5A
- 2249 78th St
- 7516 Bay Pkwy Unit 4E
- 2101 76th St
- 2039 78th St
- 2144 82nd St
- 2265 78th St
- 2276 78th St
Your Personal Tour Guide
Ask me questions while you tour the home.