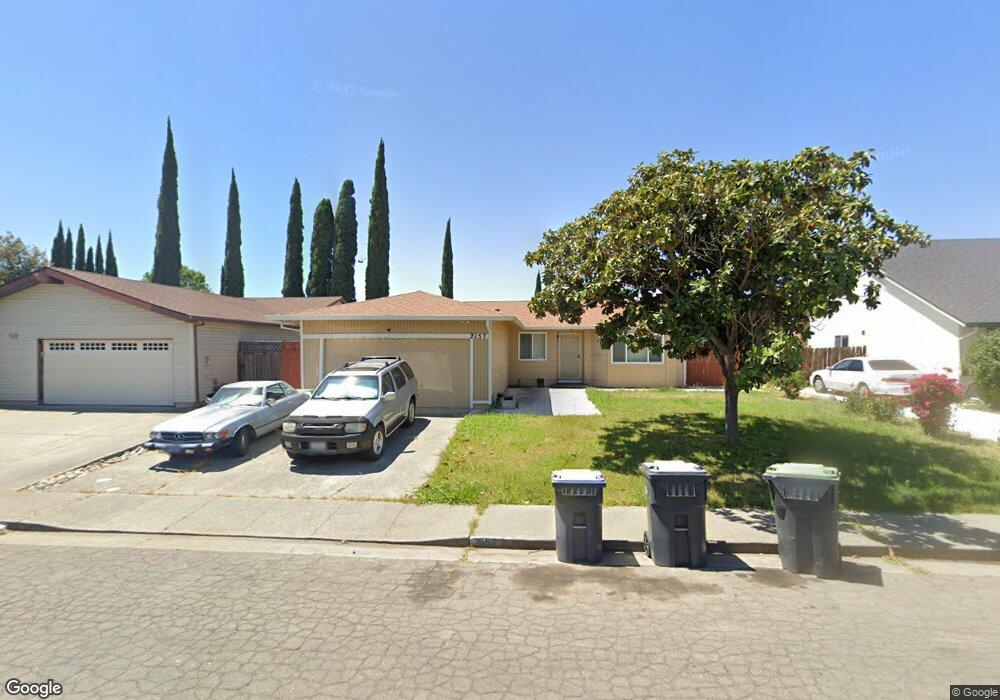
2157 Allston Place Fairfield, CA 94533
Estimated Value: $421,000 - $499,000
3
Beds
2
Baths
1,198
Sq Ft
$387/Sq Ft
Est. Value
About This Home
This home is located at 2157 Allston Place, Fairfield, CA 94533 and is currently estimated at $464,196, approximately $387 per square foot. 2157 Allston Place is a home located in Solano County with nearby schools including Tolenas Academy of Music & Media, Grange Middle School, and Fairfield High School.
Ownership History
Date
Name
Owned For
Owner Type
Purchase Details
Closed on
Feb 7, 2013
Sold by
Carvajal Eduardo Antonio and Carvajal Eduardo A
Bought by
Carvajal Eduardo Antonio
Current Estimated Value
Home Financials for this Owner
Home Financials are based on the most recent Mortgage that was taken out on this home.
Original Mortgage
$171,025
Outstanding Balance
$119,279
Interest Rate
3.36%
Mortgage Type
New Conventional
Estimated Equity
$344,917
Purchase Details
Closed on
Dec 13, 2007
Sold by
Carvajal Sylvia E
Bought by
Carvajal Eduardo A
Purchase Details
Closed on
Jun 24, 1997
Sold by
Va
Bought by
Carvajal Eduardo A and Carvajal Sylvia E
Home Financials for this Owner
Home Financials are based on the most recent Mortgage that was taken out on this home.
Original Mortgage
$102,600
Interest Rate
7.91%
Mortgage Type
Seller Take Back
Purchase Details
Closed on
Oct 11, 1996
Sold by
Countrywide Funding Corp
Bought by
Va
Create a Home Valuation Report for This Property
The Home Valuation Report is an in-depth analysis detailing your home's value as well as a comparison with similar homes in the area
Home Values in the Area
Average Home Value in this Area
Purchase History
| Date | Buyer | Sale Price | Title Company |
|---|---|---|---|
| Carvajal Eduardo Antonio | -- | First American Title | |
| Carvajal Eduardo A | -- | None Available | |
| Carvajal Eduardo A | $114,000 | -- | |
| Va | -- | Fidelity National Title Ins | |
| Countrywide Funding Corp | $93,379 | Fidelity National Title Ins |
Source: Public Records
Mortgage History
| Date | Status | Borrower | Loan Amount |
|---|---|---|---|
| Open | Carvajal Eduardo Antonio | $171,025 | |
| Closed | Carvajal Eduardo A | $102,600 |
Source: Public Records
Tax History
| Year | Tax Paid | Tax Assessment Tax Assessment Total Assessment is a certain percentage of the fair market value that is determined by local assessors to be the total taxable value of land and additions on the property. | Land | Improvement |
|---|---|---|---|---|
| 2025 | $2,014 | $185,660 | $65,142 | $120,518 |
| 2024 | $2,014 | $182,020 | $63,865 | $118,155 |
| 2023 | $1,951 | $178,452 | $62,613 | $115,839 |
| 2022 | $1,926 | $174,954 | $61,386 | $113,568 |
| 2021 | $1,906 | $171,525 | $60,183 | $111,342 |
| 2020 | $1,861 | $169,767 | $59,566 | $110,201 |
| 2019 | $1,814 | $166,440 | $58,399 | $108,041 |
| 2018 | $1,871 | $163,177 | $57,254 | $105,923 |
| 2017 | $1,783 | $159,979 | $56,132 | $103,847 |
| 2016 | $1,762 | $156,843 | $55,032 | $101,811 |
| 2015 | $1,644 | $154,488 | $54,206 | $100,282 |
| 2014 | $1,628 | $151,463 | $53,145 | $98,318 |
Source: Public Records
Map
Nearby Homes
- 2219 Channing Ct
- 1213 Sprig Ct
- 2321 Channing Place
- 2076 Harte Ct
- 2059 Tilden Ct
- 2202 Sandpiper Dr
- 2056 Davis Dr
- 1930 Grande Cir Unit 72
- 1328 Horizon Cir
- 1941 Grande Cir Unit 45
- 1941 Grande Cir Unit 48
- 1941 Grande Cir Unit 71
- 1850 Blossom Ave Unit 115
- 1464 Descanso Ln
- 102 Royal Oak Ct
- 1476 Monument Ln
- 1481 Monument Ln
- 86 Biltmore Ct
- 1488 Monument Ln
- 175 Palm Beach Ct
- 2165 Allston Place
- 2149 Allston Place
- 1356 Sanderling Dr
- 1362 Sanderling Dr
- 1350 Sanderling Dr
- 2141 Allston Place
- 2173 Allston Place
- 1344 Sanderling Dr
- 1368 Sanderling Dr
- 2160 Allston Place
- 2144 Allston Place
- 2133 Allston Place
- 2181 Allston Place
- 2168 Allston Place
- 2136 Allston Place
- 1374 Sanderling Dr
- 1338 Sanderling Dr
- 2176 Allston Place
- 2125 Allston Place
- 1345 Sanderling Dr
Your Personal Tour Guide
Ask me questions while you tour the home.