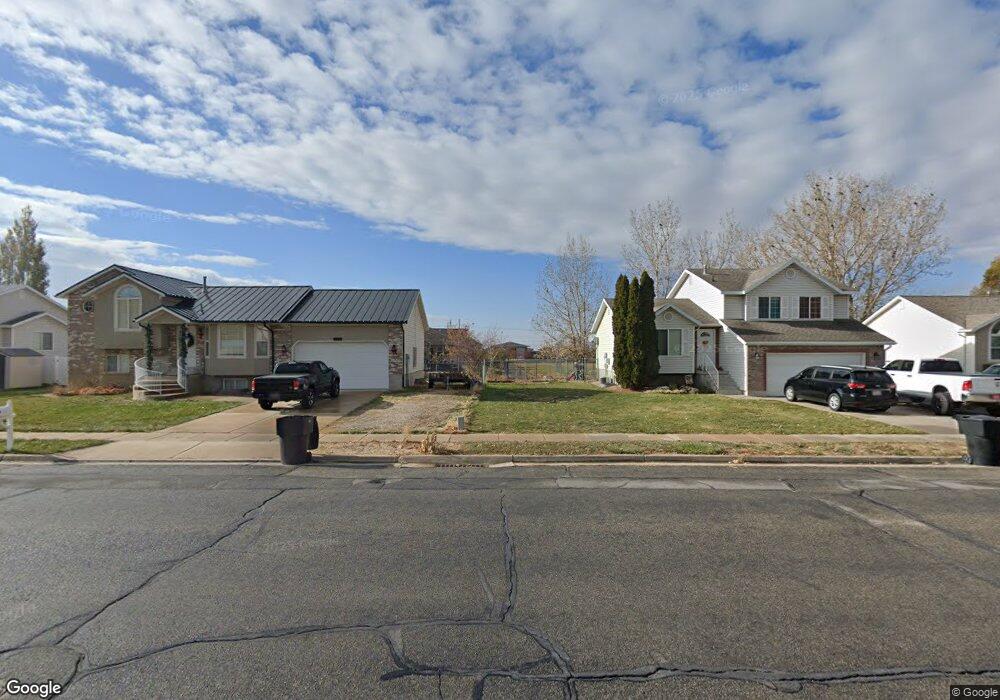
2157 W 2175 N Clearfield, UT 84015
Estimated Value: $419,000 - $475,436
4
Beds
2
Baths
2,154
Sq Ft
$205/Sq Ft
Est. Value
About This Home
This home is located at 2157 W 2175 N, Clearfield, UT 84015 and is currently estimated at $441,359, approximately $204 per square foot. 2157 W 2175 N is a home located in Davis County with nearby schools including Parkside Elementary School, West Point Junior High School, and Clearfield High School.
Ownership History
Date
Name
Owned For
Owner Type
Purchase Details
Closed on
Jan 23, 2023
Sold by
Roby Gregory Lamont
Bought by
Diamond Springs Llc
Current Estimated Value
Purchase Details
Closed on
Jun 15, 2011
Sold by
Green Daniel H
Bought by
Roark Howard and Roark Phyllis
Purchase Details
Closed on
Apr 11, 2005
Sold by
Great American Homes Inc
Bought by
Grien Daniel H
Home Financials for this Owner
Home Financials are based on the most recent Mortgage that was taken out on this home.
Original Mortgage
$122,200
Interest Rate
6.25%
Mortgage Type
New Conventional
Purchase Details
Closed on
Aug 6, 2003
Sold by
River Island Llc
Bought by
Great American Homes
Create a Home Valuation Report for This Property
The Home Valuation Report is an in-depth analysis detailing your home's value as well as a comparison with similar homes in the area
Home Values in the Area
Average Home Value in this Area
Purchase History
| Date | Buyer | Sale Price | Title Company |
|---|---|---|---|
| Diamond Springs Llc | -- | Old Republic Title | |
| Roark Howard | -- | Mountain View Title | |
| Grien Daniel H | -- | Bonneville Title Company | |
| Great American Homes | -- | Bonneville Title Company Inc |
Source: Public Records
Mortgage History
| Date | Status | Borrower | Loan Amount |
|---|---|---|---|
| Previous Owner | Grien Daniel H | $122,200 |
Source: Public Records
Tax History
| Year | Tax Paid | Tax Assessment Tax Assessment Total Assessment is a certain percentage of the fair market value that is determined by local assessors to be the total taxable value of land and additions on the property. | Land | Improvement |
|---|---|---|---|---|
| 2025 | $2,545 | $445,000 | $154,827 | $290,173 |
| 2024 | $4,428 | $235,399 | $94,124 | $141,275 |
| 2023 | $4,056 | $219,450 | $58,397 | $161,052 |
| 2022 | $4,387 | $434,000 | $120,130 | $313,870 |
| 2021 | $3,964 | $320,000 | $80,820 | $239,180 |
| 2020 | $3,442 | $275,000 | $67,689 | $207,311 |
| 2019 | $1,867 | $265,000 | $80,934 | $184,066 |
| 2018 | $1,722 | $240,000 | $68,602 | $171,398 |
| 2016 | $1,496 | $107,690 | $25,587 | $82,103 |
| 2015 | $1,376 | $94,215 | $25,587 | $68,628 |
| 2014 | $1,303 | $90,622 | $25,587 | $65,035 |
| 2013 | -- | $89,082 | $27,143 | $61,939 |
Source: Public Records
Map
Nearby Homes
- 2162 N 2290 W
- 2616 N 2125 W Unit 147
- 2266 N 2290 W
- 2434 W 2250 N
- Harvard Plan at Summerfield - Enclave
- Linden Plan at Summerfield - Vista
- Yale Plan at Summerfield - Enclave
- Stonehaven Plan at Summerfield - Vista
- Gambel Oak Plan at Summerfield - Vista
- Cedar Plan at Summerfield - Vista
- Elm Plan at Summerfield - Vista
- Princeton Plan at Summerfield - Enclave
- Cambridge Plan at Summerfield - Enclave
- Cornell Plan at Summerfield - Enclave
- Amesbury Plan at Summerfield - Vista
- Sycamore Plan at Summerfield - Vista
- Berkeley Plan at Summerfield - Enclave
- Birch Plan at Summerfield - Vista
- Stanford Plan at Summerfield - Enclave
- 2219 N 2475 W
- 2157 W 2175 N Unit 46
- 2179 W 2175 N
- 2179 W 2175 N Unit 47
- 2141 W 2175 N
- 2141 W 2175 N Unit 45
- 2158 W 2120 N
- 2158 W 2120 N Unit 9
- 2144 W 2120 N
- 2182 W 2120 N
- 2182 W 2120 N Unit 8
- 2168 W 2175 N
- 2168 W 2175 N Unit 33
- 2129 W 2175 N
- 2129 W 2175 N Unit 44
- 2154 W 2175 N
- 2154 W 2175 N Unit 34
- 2191 W 2175 N
- 2191 W 2175 N Unit 47
- 2191 W 2175 N Unit 48
- 2126 W 2120 N
Your Personal Tour Guide
Ask me questions while you tour the home.