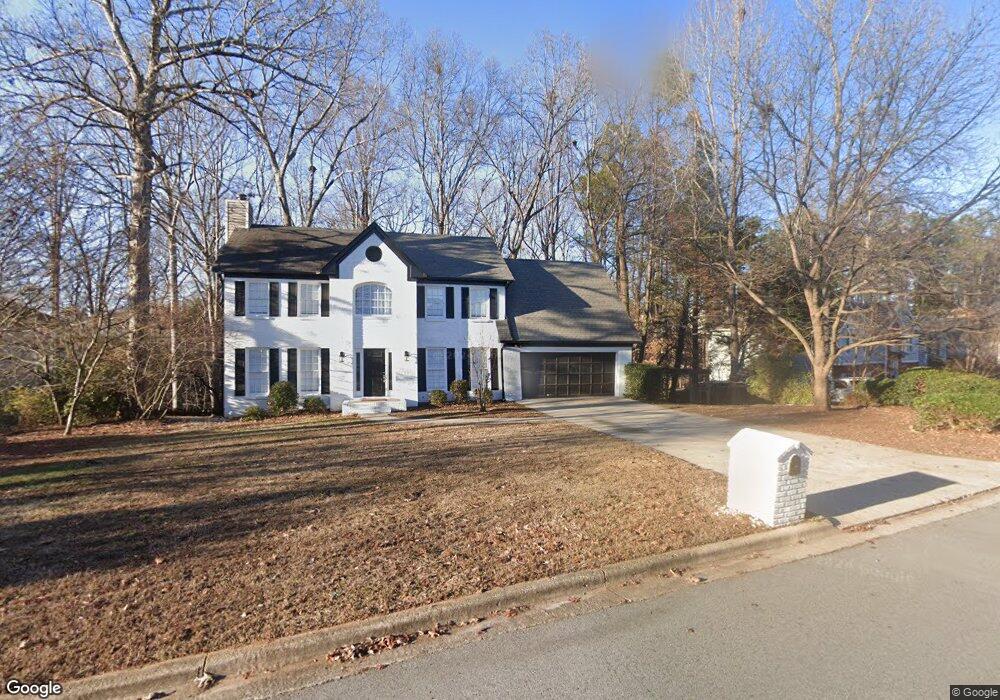
2158 Brickton Crossing Unit 28 Buford, GA 30518
Estimated Value: $479,000 - $596,000
5
Beds
4
Baths
3,127
Sq Ft
$173/Sq Ft
Est. Value
About This Home
This home is located at 2158 Brickton Crossing Unit 28, Buford, GA 30518 and is currently estimated at $540,535, approximately $172 per square foot. 2158 Brickton Crossing Unit 28 is a home located in Gwinnett County with nearby schools including Buford Elementary School, Buford Senior Academy, and Buford Academy.
Ownership History
Date
Name
Owned For
Owner Type
Purchase Details
Closed on
Mar 23, 2021
Sold by
Wright Robert
Bought by
Lcd Holding Inc
Current Estimated Value
Purchase Details
Closed on
Feb 3, 2017
Sold by
Henderson Matthew R
Bought by
Wright Robert and Wright Ashley
Home Financials for this Owner
Home Financials are based on the most recent Mortgage that was taken out on this home.
Original Mortgage
$240,562
Interest Rate
3.87%
Mortgage Type
FHA
Purchase Details
Closed on
Aug 2, 2004
Sold by
Nichols Billie C and Nichols Tom
Bought by
Henderson Matthew R and Henderson Nancy
Home Financials for this Owner
Home Financials are based on the most recent Mortgage that was taken out on this home.
Original Mortgage
$21,200
Interest Rate
5.97%
Mortgage Type
Unknown
Create a Home Valuation Report for This Property
The Home Valuation Report is an in-depth analysis detailing your home's value as well as a comparison with similar homes in the area
Home Values in the Area
Average Home Value in this Area
Purchase History
| Date | Buyer | Sale Price | Title Company |
|---|---|---|---|
| Lcd Holding Inc | $335,000 | -- | |
| Wright Robert | $245,000 | -- | |
| Henderson Matthew R | $212,000 | -- |
Source: Public Records
Mortgage History
| Date | Status | Borrower | Loan Amount |
|---|---|---|---|
| Previous Owner | Wright Robert | $240,562 | |
| Previous Owner | Henderson Matthew R | $21,200 | |
| Previous Owner | Henderson Matthew R | $169,600 |
Source: Public Records
Tax History Compared to Growth
Tax History
| Year | Tax Paid | Tax Assessment Tax Assessment Total Assessment is a certain percentage of the fair market value that is determined by local assessors to be the total taxable value of land and additions on the property. | Land | Improvement |
|---|---|---|---|---|
| 2025 | $2,981 | $207,760 | $44,000 | $163,760 |
| 2024 | $2,696 | $187,880 | $44,000 | $143,880 |
| 2023 | $2,696 | $199,840 | $44,000 | $155,840 |
| 2022 | $1,923 | $134,000 | $28,400 | $105,600 |
| 2021 | $1,576 | $109,840 | $28,400 | $81,440 |
| 2020 | $1,576 | $109,840 | $28,400 | $81,440 |
| 2019 | $1,270 | $98,000 | $22,800 | $75,200 |
| 2018 | $1,270 | $98,000 | $22,800 | $75,200 |
| 2016 | $1,171 | $91,400 | $22,800 | $68,600 |
| 2015 | $1,000 | $75,360 | $14,800 | $60,560 |
| 2014 | -- | $75,360 | $14,800 | $60,560 |
Source: Public Records
Map
Nearby Homes
- 4316 Woodland Bank Blvd
- 4245 Woodland Bank Blvd
- 4385 Signal Ridge Ct
- 190 Maddox Rd
- 2267 Pink Hawthorn Dr
- 103 Maddox Rd
- 4238 Hamilton Mill Rd
- 2446 Thrasher Rd
- 2398 E Maddox Rd
- 2151 E Maddox Rd
- 3 Buford Village Walk
- 21 Buford Village Walk
- 2255 Buford Hwy
- 2255 Buford Hwy
- 2350 E Maddox Rd
- 2352 E Maddox Rd
- 2101 E Maddox Rd
- 4831 Miller Hill Rd
- 1966 Sterling Park
- 4017 S South Bogan Rd
- 2148 Brickton Crossing
- 2178 Brickton Crossing
- 2138 Brickton Crossing
- 2188 Brickton Crossing
- 2191 Woodbriar Dr
- 2159 Brickton Crossing
- 2159 Brickton Crossing
- 2185 Woodbriar Dr
- 2169 Brickton Crossing
- 2197 Woodbriar Dr
- 2149 Brickton Crossing Unit 1
- 2179 Woodbriar Dr
- 2179 Brickton Crossing
- 2128 Brickton Crossing Unit 1
- 2198 Brickton Crossing Unit I
- 2179 Brickton Crossing
- 2139 Brickton Crossing
- 2203 Woodbriar Dr
- 2173 Woodbriar Dr