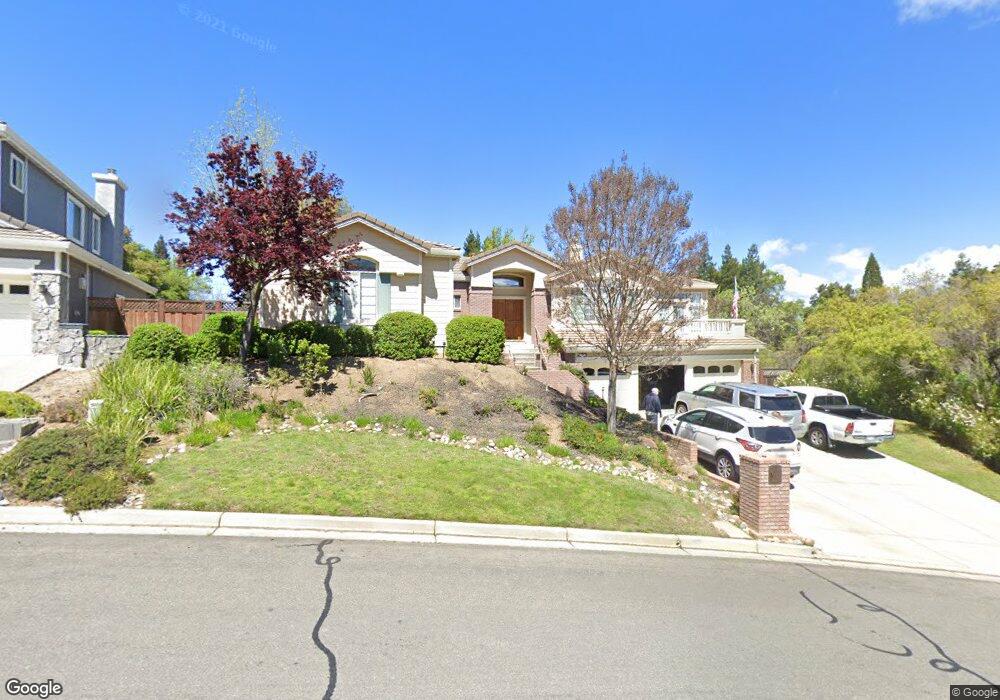
2158 Hidden Pond Rd Lafayette, CA 94549
Estimated Value: $1,874,501 - $2,301,000
4
Beds
4
Baths
3,352
Sq Ft
$614/Sq Ft
Est. Value
About This Home
This home is located at 2158 Hidden Pond Rd, Lafayette, CA 94549 and is currently estimated at $2,059,375, approximately $614 per square foot. 2158 Hidden Pond Rd is a home located in Contra Costa County with nearby schools including John Swett Elementary School, Martinez Junior High School, and Alhambra Senior High School.
Ownership History
Date
Name
Owned For
Owner Type
Purchase Details
Closed on
Feb 15, 2002
Sold by
Eldridge Robert George and Eldridge Roberta D
Bought by
Rosenthal Joel W and Rosenthal Barbara Ann Jageman
Current Estimated Value
Home Financials for this Owner
Home Financials are based on the most recent Mortgage that was taken out on this home.
Original Mortgage
$670,000
Outstanding Balance
$241,417
Interest Rate
5.25%
Mortgage Type
Purchase Money Mortgage
Estimated Equity
$1,817,958
Purchase Details
Closed on
Oct 13, 1994
Sold by
Davidon Development Company L P
Bought by
Eldridge Robert George and Eldridge Roberta D
Home Financials for this Owner
Home Financials are based on the most recent Mortgage that was taken out on this home.
Original Mortgage
$350,000
Interest Rate
8.5%
Mortgage Type
Purchase Money Mortgage
Create a Home Valuation Report for This Property
The Home Valuation Report is an in-depth analysis detailing your home's value as well as a comparison with similar homes in the area
Purchase History
| Date | Buyer | Sale Price | Title Company |
|---|---|---|---|
| Rosenthal Joel W | $837,500 | Old Republic Title Company | |
| Eldridge Robert George | $540,000 | Old Republic Title Company |
Source: Public Records
Mortgage History
| Date | Status | Borrower | Loan Amount |
|---|---|---|---|
| Open | Rosenthal Joel W | $670,000 | |
| Previous Owner | Eldridge Robert George | $350,000 |
Source: Public Records
Tax History
| Year | Tax Paid | Tax Assessment Tax Assessment Total Assessment is a certain percentage of the fair market value that is determined by local assessors to be the total taxable value of land and additions on the property. | Land | Improvement |
|---|---|---|---|---|
| 2025 | $15,308 | $1,237,224 | $590,914 | $646,310 |
| 2024 | $14,375 | $1,212,966 | $579,328 | $633,638 |
| 2023 | $14,375 | $1,189,183 | $567,969 | $621,214 |
| 2022 | $14,128 | $1,165,867 | $556,833 | $609,034 |
| 2021 | $13,851 | $1,143,008 | $545,915 | $597,093 |
| 2019 | $13,575 | $1,109,108 | $529,724 | $579,384 |
| 2018 | $13,035 | $1,087,362 | $519,338 | $568,024 |
| 2017 | $12,864 | $1,066,042 | $509,155 | $556,887 |
| 2016 | $11,969 | $1,045,140 | $499,172 | $545,968 |
| 2015 | $11,878 | $1,029,442 | $491,674 | $537,768 |
| 2014 | $11,714 | $1,009,277 | $482,043 | $527,234 |
Source: Public Records
Map
Nearby Homes
- 966 Oak Vista Ct
- 1239 Sunrise Ridge Dr
- 657 Byrdee Way
- 407 Roanoke Dr
- 203 Virginia Cir
- 222 Donegal Way
- 834 Carter Acres Ln
- 241 Blue Ridge Dr
- 61 Banbridge Place
- 120 Arbor View Ln
- 11 Paddock Ct
- 12 Paddock Ct
- 137 Haslemere Ct
- 120 Haslemere Ct
- 3284 Surmont Dr
- 14 Heritage Oaks Rd
- 10 Pomfret Walk Unit 11
- 160 Southwind Dr
- 726 Grayson Rd
- 1903 Via Ferrari
- 2166 Hidden Pond Rd
- 905 Dana Highlands Ct
- 2174 Hidden Pond Rd
- 806 Hidden Pond Ct
- 913 Dana Highlands Ct
- 740 Upper Pond Ct
- 812 Hidden Pond Ct
- 800 Hidden Pond Ct
- 820 Hidden Pond Ct
- 912 Dana Highlands Ct
- 965 Oak Vista Ct
- 950 Oak Vista Ct
- 921 Dana Highlands Ct
- 830 Hidden Pond Ct
- 748 Upper Pond Ct
- 920 Dana Highlands Ct
- 805 Hidden Pond Ct
- 958 Oak Vista Ct
- 2245 Hidden Pond Ln
- 2182 Hidden Pond Rd
Your Personal Tour Guide
Ask me questions while you tour the home.