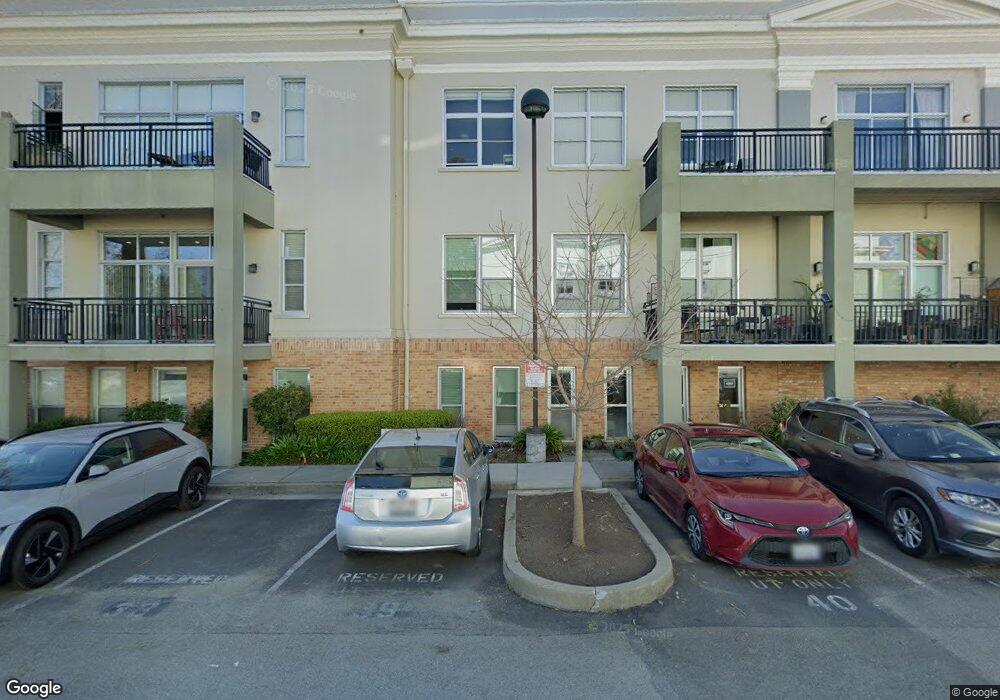
2158 Jefferson Ave Unit 68 Berkeley, CA 94703
Downtown Berkeley NeighborhoodEstimated Value: $409,000 - $867,000
2
Beds
1
Bath
1,167
Sq Ft
$529/Sq Ft
Est. Value
About This Home
This home is located at 2158 Jefferson Ave Unit 68, Berkeley, CA 94703 and is currently estimated at $616,887, approximately $528 per square foot. 2158 Jefferson Ave Unit 68 is a home located in Alameda County with nearby schools including Washington Elementary School, Oxford Elementary School, and Berkeley Arts Magnet at Whittier School.
Ownership History
Date
Name
Owned For
Owner Type
Purchase Details
Closed on
Oct 1, 2015
Sold by
Mitchell Clifford and Qualley Pamela Ann
Bought by
Variano Evan Abraham and Reynolds Sarah Anne
Current Estimated Value
Home Financials for this Owner
Home Financials are based on the most recent Mortgage that was taken out on this home.
Original Mortgage
$230,750
Outstanding Balance
$181,429
Interest Rate
3.86%
Mortgage Type
Unknown
Estimated Equity
$435,458
Purchase Details
Closed on
Oct 27, 2012
Sold by
Mitchell Clifford L and Qualley Pamela A
Bought by
Mitchell Clifford and Qualley Pamela Ann
Purchase Details
Closed on
Mar 26, 1997
Sold by
Regents Of The University Of California
Bought by
Mitchell Clifford L and Qualley Pamela A
Home Financials for this Owner
Home Financials are based on the most recent Mortgage that was taken out on this home.
Original Mortgage
$124,000
Interest Rate
7.63%
Create a Home Valuation Report for This Property
The Home Valuation Report is an in-depth analysis detailing your home's value as well as a comparison with similar homes in the area
Home Values in the Area
Average Home Value in this Area
Purchase History
| Date | Buyer | Sale Price | Title Company |
|---|---|---|---|
| Variano Evan Abraham | $256,500 | Old Republic Title | |
| Mitchell Clifford | -- | None Available | |
| Mitchell Clifford L | $155,000 | Old Republic Title Company |
Source: Public Records
Mortgage History
| Date | Status | Borrower | Loan Amount |
|---|---|---|---|
| Open | Variano Evan Abraham | $230,750 | |
| Previous Owner | Mitchell Clifford L | $124,000 |
Source: Public Records
Tax History
| Year | Tax Paid | Tax Assessment Tax Assessment Total Assessment is a certain percentage of the fair market value that is determined by local assessors to be the total taxable value of land and additions on the property. | Land | Improvement |
|---|---|---|---|---|
| 2025 | $5,701 | $296,518 | $94,701 | $208,817 |
| 2024 | $5,701 | $290,566 | $92,844 | $204,722 |
| 2023 | $5,568 | $291,733 | $91,024 | $200,709 |
| 2022 | $5,441 | $279,014 | $89,240 | $196,774 |
| 2021 | $5,433 | $273,406 | $87,490 | $192,916 |
| 2020 | $5,088 | $277,531 | $86,593 | $190,938 |
| 2019 | $4,826 | $272,091 | $84,896 | $187,195 |
| 2018 | $4,728 | $266,758 | $83,232 | $183,526 |
| 2017 | $4,545 | $261,528 | $81,600 | $179,928 |
| 2016 | $4,352 | $256,400 | $80,000 | $176,400 |
| 2015 | $3,767 | $210,043 | $60,980 | $149,063 |
| 2014 | $3,721 | $205,929 | $59,786 | $146,143 |
Source: Public Records
Map
Nearby Homes
- 2118 California St
- 2218 -2222 Grant St
- 1813 Sacramento St
- 1411 Hearst Ave Unit 2
- 1436 Delaware St
- 2350 Sacramento St
- 1645 Dwight Way
- 1261 Hearst Ave
- 1919 Curtis St
- 1612 Parker St
- 2144 Curtis St
- 1322 Virginia St
- 2324 Browning St
- 1564 Sacramento St
- 1808 Cedar St
- 2231 Byron St
- 1625 Martin Luther King jr Way
- 1901 Parker St Unit 3
- 1612 Carleton St
- 1207 Francisco St
- 2146 Jefferson Ave Unit 70
- 2152 Jefferson Ave Unit 69
- 2144 Jefferson Ave Unit 67
- 2140 Jefferson Ave Unit 66
- 2138 Jefferson Ave Unit 65
- 2134 Jefferson Ave Unit 64
- 2132 Jefferson Ave Unit 63
- 2130 Jefferson Ave Unit 62
- 2136 Jefferson Ave Unit 61
- 2142 Jefferson Ave Unit 60
- 2128 Jefferson Ave Unit 59
- 2126 Jefferson Ave Unit 58
- 2124 Jefferson Ave Unit 57
- 1611 Allston Way Unit 56
- 1609 Allston Way Unit 55
- 2104 Jefferson Ave Unit 6
- 2118 Jefferson Ave Unit 5
- 2102 Jefferson Ave Unit 4
- 2120 Jefferson Ave Unit 3
- 2100 Jefferson Ave Unit 2
Your Personal Tour Guide
Ask me questions while you tour the home.