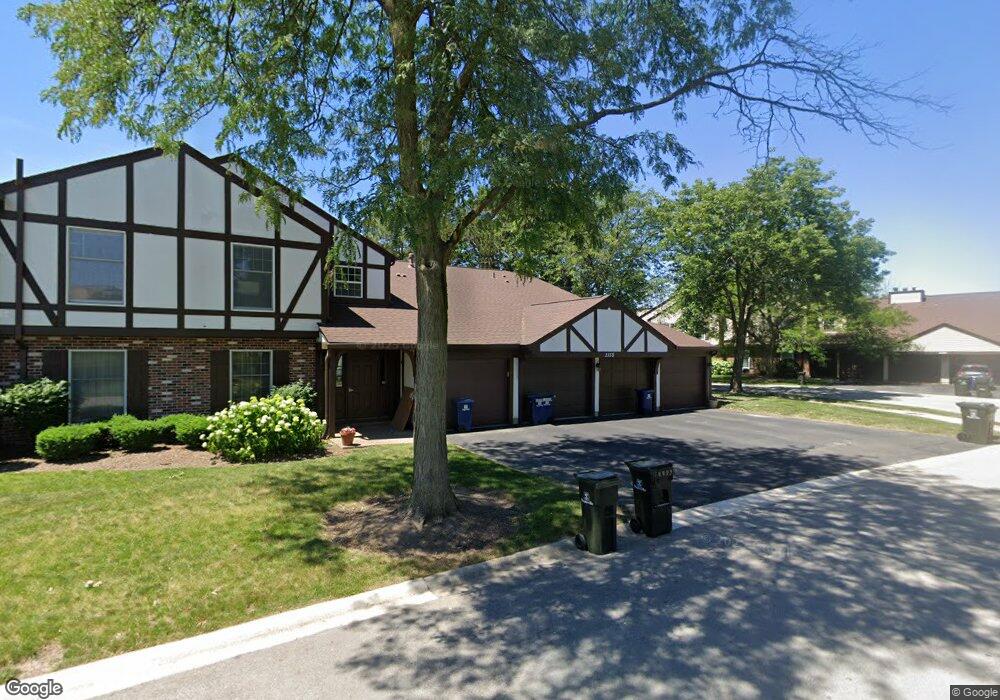
2158 Lancaster Cir Unit 102D Naperville, IL 60565
Old Farm NeighborhoodEstimated Value: $255,000 - $275,000
2
Beds
2
Baths
1,067
Sq Ft
$250/Sq Ft
Est. Value
About This Home
This home is located at 2158 Lancaster Cir Unit 102D, Naperville, IL 60565 and is currently estimated at $266,608, approximately $249 per square foot. 2158 Lancaster Cir Unit 102D is a home located in DuPage County with nearby schools including Kingsley Elementary School, Lincoln Jr. High School, and Naperville Central High School.
Ownership History
Date
Name
Owned For
Owner Type
Purchase Details
Closed on
May 16, 2016
Sold by
Perell Eileen J
Bought by
Perell Eileen J and Eileen Perell Trust
Current Estimated Value
Purchase Details
Closed on
Aug 13, 2009
Sold by
Jozwiak Maryann S and Finnegan Barbara Anne
Bought by
Perell Eileen J
Home Financials for this Owner
Home Financials are based on the most recent Mortgage that was taken out on this home.
Original Mortgage
$117,750
Outstanding Balance
$77,047
Interest Rate
5.28%
Mortgage Type
New Conventional
Estimated Equity
$189,561
Purchase Details
Closed on
Dec 15, 2008
Sold by
Jozwiak Maryann S and Finnegan Barbara Anne
Bought by
Jozwiak Maryann S and Finnegan Barbara Anne
Purchase Details
Closed on
Jan 26, 1996
Sold by
Schumacher Anna B
Bought by
Schumacher Ann B and The Anna B Schumacher Living Trust
Purchase Details
Closed on
Aug 1, 1994
Sold by
Firstar Bank West Na
Bought by
Schumacher Anna B
Create a Home Valuation Report for This Property
The Home Valuation Report is an in-depth analysis detailing your home's value as well as a comparison with similar homes in the area
Home Values in the Area
Average Home Value in this Area
Purchase History
| Date | Buyer | Sale Price | Title Company |
|---|---|---|---|
| Perell Eileen J | -- | Attorney | |
| Perell Eileen J | $157,000 | Naperville Title Company | |
| Jozwiak Maryann S | -- | None Available | |
| Schumacher Ann B | -- | -- | |
| Schumacher Anna B | $97,500 | Intercounty Title Company |
Source: Public Records
Mortgage History
| Date | Status | Borrower | Loan Amount |
|---|---|---|---|
| Open | Perell Eileen J | $117,750 |
Source: Public Records
Tax History Compared to Growth
Tax History
| Year | Tax Paid | Tax Assessment Tax Assessment Total Assessment is a certain percentage of the fair market value that is determined by local assessors to be the total taxable value of land and additions on the property. | Land | Improvement |
|---|---|---|---|---|
| 2024 | $1,421 | $68,788 | $6,892 | $61,896 |
| 2023 | $1,508 | $62,780 | $6,290 | $56,490 |
| 2022 | $1,825 | $55,720 | $5,580 | $50,140 |
| 2021 | $2,766 | $53,610 | $5,370 | $48,240 |
| 2020 | $1,826 | $52,640 | $5,270 | $47,370 |
| 2019 | $1,856 | $50,360 | $5,040 | $45,320 |
| 2018 | $1,857 | $46,380 | $4,640 | $41,740 |
| 2017 | $1,886 | $44,810 | $4,480 | $40,330 |
| 2016 | $1,921 | $43,190 | $4,320 | $38,870 |
| 2015 | $2,033 | $40,670 | $4,070 | $36,600 |
| 2014 | $2,099 | $39,200 | $3,920 | $35,280 |
| 2013 | $2,285 | $42,250 | $4,230 | $38,020 |
Source: Public Records
Map
Nearby Homes
- 2132 Berkley Ct Unit 201A
- 47 Glencoe Ct Unit 102D
- 23 Glencoe Ct Unit 202B
- 221 Hampshire Ct Unit 201D
- 1921 Wisteria Ct Unit 3
- 2337 Worthing Dr Unit 102A
- 35 Foxcroft Rd Unit 123
- 2279 Kaskaskia Ct
- 2167 Countryside Cir
- 2276 Kaskaskia Ct
- 302 Carriage Hill Rd
- 312 Leeds Ct
- 336 Brooklea Ct
- 2280 Barth Dr
- 2421 River Woods Dr
- 1751 S Washington St Unit 1
- 36 Oak Bluff Ct
- 44 Oak Bluff Ct
- 343 Danbury Dr Unit 6B
- 517 Sheffield Rd
- 2158 Lancaster Cir Unit 201C
- 2148 Lancaster Cir Unit 201A
- 2148 Lancaster Cir Unit 102B
- 2158 Lancaster Cir Unit 202D
- 2148 Lancaster Cir Unit 101A
- 2158 Lancaster Cir Unit 101C
- 2146 Sunderland Ct Unit 201A
- 2146 Sunderland Ct Unit 101A
- 2146 Sunderland Ct Unit 202B
- 2153 Lancaster Cir Unit 202B
- 2153 Lancaster Cir Unit 3201A
- 2153 Lancaster Cir Unit 102B
- 2153 Lancaster Cir Unit 3101A
- 2169 Sunderland Ct Unit 202A
- 2169 Sunderland Ct Unit 201B
- 2169 Sunderland Ct Unit 102A
- 2147 Berkley Ct Unit 202B
- 2147 Berkley Ct Unit 101A
- 2147 Berkley Ct Unit 201A
- 2151 Berkley Ct Unit 101C