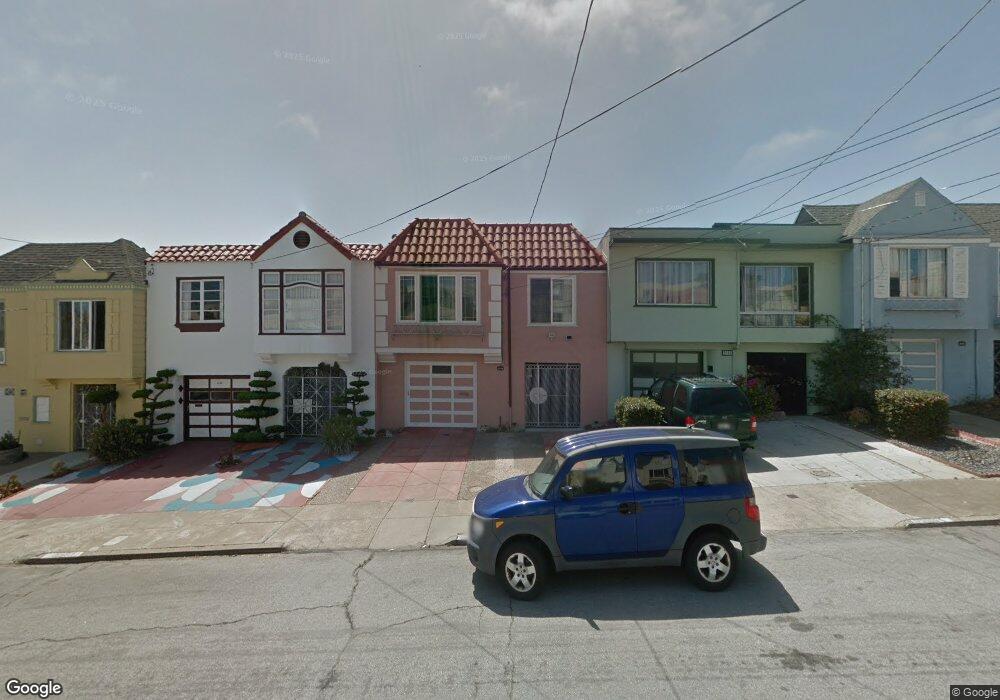
2159 33rd Ave San Francisco, CA 94116
Parkside NeighborhoodEstimated Value: $1,542,000 - $1,951,581
3
Beds
2
Baths
1,450
Sq Ft
$1,196/Sq Ft
Est. Value
About This Home
This home is located at 2159 33rd Ave, San Francisco, CA 94116 and is currently estimated at $1,734,895, approximately $1,196 per square foot. 2159 33rd Ave is a home located in San Francisco County with nearby schools including Stevenson (Robert Louis) Elementary School, Giannini (A.P.) Middle School, and St. Gabriel School.
Ownership History
Date
Name
Owned For
Owner Type
Purchase Details
Closed on
Jul 30, 2022
Sold by
Yim Lau Alvin Kwock
Bought by
Lau/Lei Family Trust
Current Estimated Value
Purchase Details
Closed on
May 28, 2009
Sold by
Milrod Sonia Rela
Bought by
Lau Alvin Kwock Yim and Lei Vicky Bi Yu
Home Financials for this Owner
Home Financials are based on the most recent Mortgage that was taken out on this home.
Original Mortgage
$540,000
Interest Rate
4.78%
Mortgage Type
Purchase Money Mortgage
Purchase Details
Closed on
Mar 28, 2005
Sold by
Milrod Lydia R
Bought by
Milrod Lydia R
Create a Home Valuation Report for This Property
The Home Valuation Report is an in-depth analysis detailing your home's value as well as a comparison with similar homes in the area
Home Values in the Area
Average Home Value in this Area
Purchase History
| Date | Buyer | Sale Price | Title Company |
|---|---|---|---|
| Lau/Lei Family Trust | -- | Law Offices Of Bresler & Lee | |
| Lau Alvin Kwock Yim | $839,000 | Old Republic Title Company | |
| Milrod Lydia R | -- | None Available |
Source: Public Records
Mortgage History
| Date | Status | Borrower | Loan Amount |
|---|---|---|---|
| Previous Owner | Lau Alvin Kwock Yim | $540,000 |
Source: Public Records
Tax History Compared to Growth
Tax History
| Year | Tax Paid | Tax Assessment Tax Assessment Total Assessment is a certain percentage of the fair market value that is determined by local assessors to be the total taxable value of land and additions on the property. | Land | Improvement |
|---|---|---|---|---|
| 2025 | $14,403 | $1,192,550 | $756,297 | $436,253 |
| 2024 | $14,403 | $1,169,168 | $741,468 | $427,700 |
| 2023 | $14,183 | $1,146,245 | $726,930 | $419,315 |
| 2022 | $13,867 | $1,123,750 | $712,670 | $411,080 |
| 2021 | $13,619 | $1,101,720 | $698,698 | $403,022 |
| 2020 | $13,686 | $1,090,424 | $691,534 | $398,890 |
| 2019 | $13,215 | $1,069,046 | $677,976 | $391,070 |
| 2018 | $12,769 | $1,048,088 | $664,684 | $383,404 |
| 2017 | $12,319 | $1,027,540 | $651,652 | $375,888 |
| 2016 | $12,113 | $1,007,396 | $638,876 | $368,520 |
| 2015 | $11,962 | $992,266 | $629,280 | $362,986 |
| 2014 | $11,645 | $972,832 | $616,954 | $355,878 |
Source: Public Records
Map
Nearby Homes