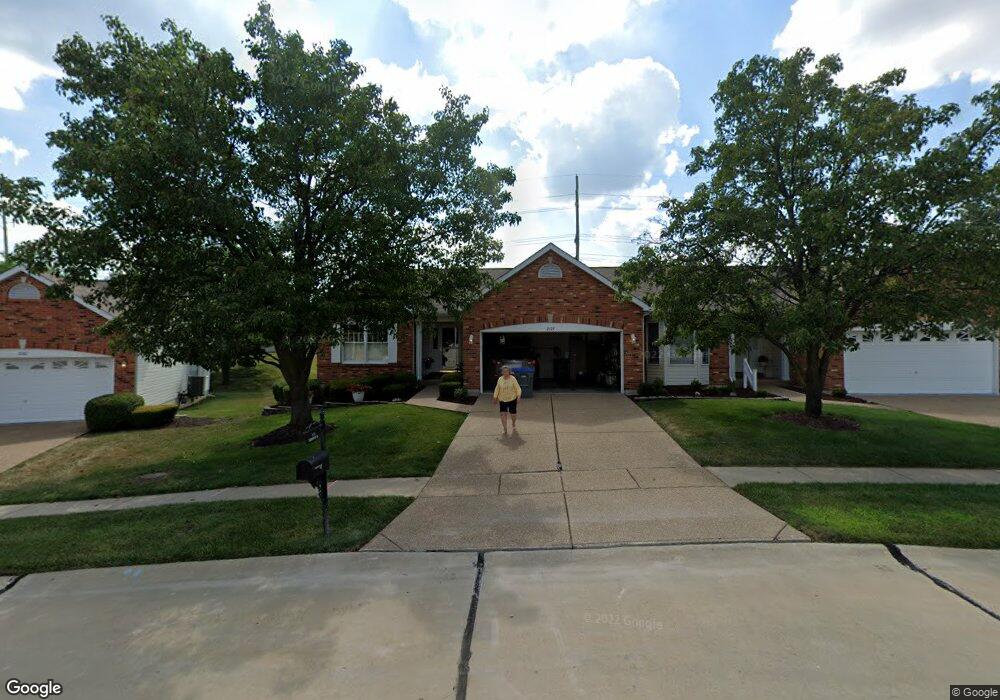
2159 Farnsworth Dr O Fallon, MO 63368
Estimated Value: $316,000 - $376,000
2
Beds
2
Baths
1,404
Sq Ft
$240/Sq Ft
Est. Value
About This Home
This home is located at 2159 Farnsworth Dr, O Fallon, MO 63368 and is currently estimated at $337,338, approximately $240 per square foot. 2159 Farnsworth Dr is a home located in St. Charles County with nearby schools including Pheasant Point Elementary School, Fort Zumwalt West Middle School, and Fort Zumwalt West High School.
Ownership History
Date
Name
Owned For
Owner Type
Purchase Details
Closed on
Feb 9, 2011
Sold by
Skotnicki Berneice J and Skotnicki Curtis Lee
Bought by
Monarch Management Services Llc
Current Estimated Value
Purchase Details
Closed on
Feb 18, 2010
Sold by
Skotnicki Berneice J
Bought by
Skotnicki Berneice J and Skotnicki Curtis Lee
Purchase Details
Closed on
Mar 31, 2009
Sold by
Boedges Christopher Joseph and The Patricia M Boedges R/L/T/A
Bought by
Skotnicki Gene D and Skotnicki Berneice J
Home Financials for this Owner
Home Financials are based on the most recent Mortgage that was taken out on this home.
Original Mortgage
$168,547
Interest Rate
5.16%
Mortgage Type
VA
Purchase Details
Closed on
Sep 28, 1999
Sold by
Whittaker Construction Inc
Bought by
Boedges Patricia M and The Patricia M Boedges R/L/T/A
Home Financials for this Owner
Home Financials are based on the most recent Mortgage that was taken out on this home.
Original Mortgage
$116,000
Interest Rate
8.02%
Create a Home Valuation Report for This Property
The Home Valuation Report is an in-depth analysis detailing your home's value as well as a comparison with similar homes in the area
Home Values in the Area
Average Home Value in this Area
Purchase History
| Date | Buyer | Sale Price | Title Company |
|---|---|---|---|
| Monarch Management Services Llc | $165,000 | Ust | |
| Skotnicki Berneice J | -- | None Available | |
| Skotnicki Gene D | -- | Inv | |
| Boedges Patricia M | -- | -- |
Source: Public Records
Mortgage History
| Date | Status | Borrower | Loan Amount |
|---|---|---|---|
| Previous Owner | Skotnicki Gene D | $168,547 | |
| Previous Owner | Boedges Patricia M | $116,000 |
Source: Public Records
Tax History
| Year | Tax Paid | Tax Assessment Tax Assessment Total Assessment is a certain percentage of the fair market value that is determined by local assessors to be the total taxable value of land and additions on the property. | Land | Improvement |
|---|---|---|---|---|
| 2025 | $3,462 | $57,634 | -- | -- |
| 2023 | $3,463 | $52,262 | $0 | $0 |
| 2022 | $3,141 | $44,071 | $0 | $0 |
| 2021 | $3,143 | $44,071 | $0 | $0 |
| 2020 | $2,980 | $40,476 | $0 | $0 |
| 2019 | $2,987 | $40,476 | $0 | $0 |
| 2018 | $2,750 | $35,567 | $0 | $0 |
| 2017 | $2,713 | $35,567 | $0 | $0 |
| 2016 | $2,506 | $32,724 | $0 | $0 |
| 2015 | $2,330 | $32,724 | $0 | $0 |
| 2014 | $2,151 | $29,702 | $0 | $0 |
Source: Public Records
Map
Nearby Homes
- 2136 Farnsworth Dr Unit D
- 7139 Basswood Dr
- 7101 Curtis Dr Unit 795B
- 2614 Samuel Dr Unit 711C
- 7131 Curtis Dr Unit 779C
- 7409 Heathermoor Ln
- 516 Sunward Dr
- 178 Christina Marie Dr
- 2 the Durango at the Grove
- 3 Dragonstone Ct
- 604 Sunward Dr
- 2726 Brook Meadow Ln
- 7 Dragonstone Ct
- New Build Glacier "E" at Dragonstone
- 189 Sanctuary Dr
- New Build Savannah "E" at Dragonstone
- 2613 Tysons Pkwy
- 3 Royallbend Ct
- 2026 Avalon Mist Cir
- 1166 Saint Theresa Dr
- 2157 Farnsworth Dr
- 2161 Farnsworth Dr
- 2163 Farnsworth Dr
- 2153 Farnsworth Dr
- 2153 Farnsworth Dr Unit D
- 2155 Farnsworth Dr
- 2155 Farnsworth Dr Unit C
- 2164 Farnsworth Dr
- 2150 Farnsworth Dr
- 2150 Farnsworth Dr Unit 1445C
- 2165 Farnsworth Dr
- 2151 Farnsworth Dr
- 2195 Mcgregor Cir
- 2193 Mcgregor Cir
- 2167 Farnsworth Dr
- 2166 Farnsworth Dr
- 2148 Farnsworth Dr
- 2148 Farnsworth Dr Unit 1445B
- 2149 Farnsworth Dr
- 2191 Mcgregor Cir
Your Personal Tour Guide
Ask me questions while you tour the home.