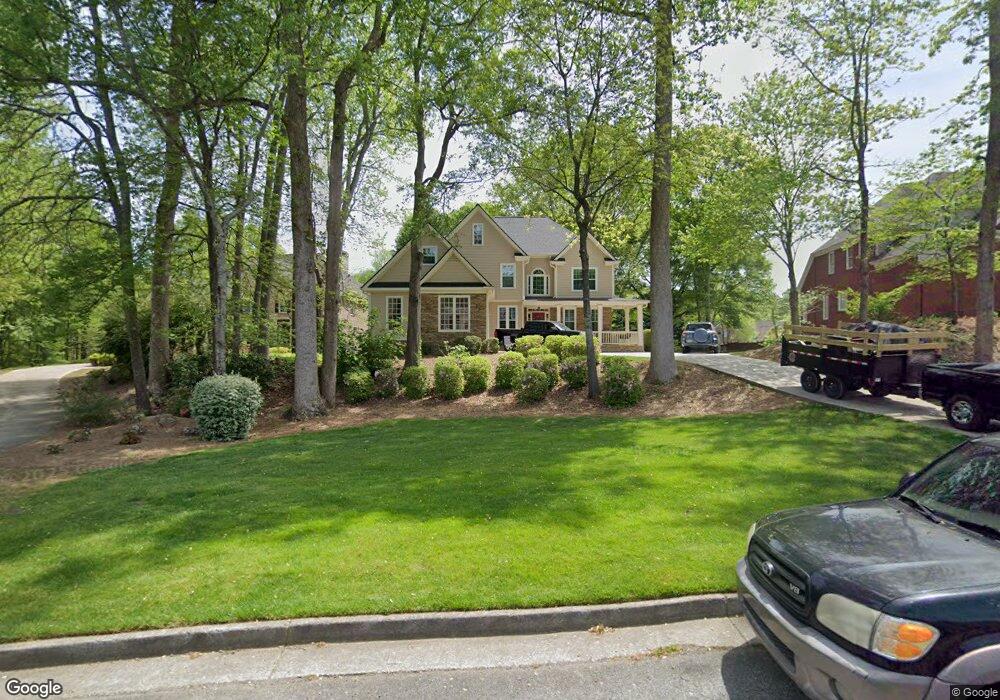
2159 Unity Trail NW Marietta, GA 30064
West Cobb NeighborhoodEstimated Value: $715,301 - $770,000
5
Beds
5
Baths
3,221
Sq Ft
$231/Sq Ft
Est. Value
About This Home
This home is located at 2159 Unity Trail NW, Marietta, GA 30064 and is currently estimated at $744,575, approximately $231 per square foot. 2159 Unity Trail NW is a home located in Cobb County with nearby schools including Cheatham Hill Elementary School, Pine Mountain Middle School, and Kennesaw Mountain High School.
Ownership History
Date
Name
Owned For
Owner Type
Purchase Details
Closed on
Aug 21, 2025
Sold by
Engelstad Stephen P and Engelstad Deborah A
Bought by
Engelstad Family Trust and Engelstad
Current Estimated Value
Purchase Details
Closed on
Sep 15, 2004
Sold by
Engelstad Stephen P
Bought by
Engelstad Stephen P and Engelstad Deborah
Home Financials for this Owner
Home Financials are based on the most recent Mortgage that was taken out on this home.
Original Mortgage
$74,950
Interest Rate
5.73%
Mortgage Type
Stand Alone Refi Refinance Of Original Loan
Purchase Details
Closed on
Nov 30, 1998
Sold by
Wysocki Brothers Inc
Bought by
Parsons Steven C and Lisa Ann
Home Financials for this Owner
Home Financials are based on the most recent Mortgage that was taken out on this home.
Original Mortgage
$169,900
Interest Rate
6.77%
Mortgage Type
New Conventional
Create a Home Valuation Report for This Property
The Home Valuation Report is an in-depth analysis detailing your home's value as well as a comparison with similar homes in the area
Home Values in the Area
Average Home Value in this Area
Purchase History
| Date | Buyer | Sale Price | Title Company |
|---|---|---|---|
| Engelstad Family Trust | -- | None Listed On Document | |
| Engelstad Stephen P | -- | -- | |
| Parsons Steven C | $289,900 | -- |
Source: Public Records
Mortgage History
| Date | Status | Borrower | Loan Amount |
|---|---|---|---|
| Previous Owner | Engelstad Stephen P | $74,950 | |
| Previous Owner | Parsons Steven C | $169,900 |
Source: Public Records
Tax History Compared to Growth
Tax History
| Year | Tax Paid | Tax Assessment Tax Assessment Total Assessment is a certain percentage of the fair market value that is determined by local assessors to be the total taxable value of land and additions on the property. | Land | Improvement |
|---|---|---|---|---|
| 2024 | $1,767 | $238,896 | $36,000 | $202,896 |
| 2023 | $1,560 | $238,896 | $36,000 | $202,896 |
| 2022 | $1,641 | $196,872 | $36,000 | $160,872 |
| 2021 | $1,586 | $178,456 | $36,000 | $142,456 |
| 2020 | $1,519 | $156,088 | $30,000 | $126,088 |
| 2019 | $4,280 | $156,088 | $30,000 | $126,088 |
| 2018 | $4,280 | $156,088 | $30,000 | $126,088 |
| 2017 | $4,084 | $156,088 | $30,000 | $126,088 |
| 2016 | $3,229 | $121,200 | $26,000 | $95,200 |
| 2015 | $3,310 | $121,200 | $26,000 | $95,200 |
| 2014 | $3,338 | $121,200 | $0 | $0 |
Source: Public Records
Map
Nearby Homes
- 2139 Bramlett Place NW
- 2150 Unity Trail NW
- 116 Mount Calvary Rd NW
- 396 Battlefield Creek Dr
- 2760 Granite Way NW
- 234 Everleigh Way
- 2372 Battle Forest Dr SW
- 103 Stone Mill Ln NW
- 302 Summer Garden Dr
- 319 Summer Garden Dr
- 510 Towneside Ln
- 2107 Old Dallas Rd SW
- 211 Mcdaniel Rd NW
- 2470 Anderson Estates Ct
- 2228 Old Dallas Rd SW
- 2201 Old Dallas Rd SW
- 608 Tabbystone St NW Unit 2
- 2161 Unity Trail NW Unit 2
- 2157 Unity Trail NW
- 2163 Unity Trail NW Unit 2
- 2162 Unity Trail NW Unit II
- 2165 Unity Trail NW
- 2164 Unity Trail NW
- 2140 Bramlett Place NW
- 2137 Bramlett Place NW
- 232 Unity Dr NW
- 2135 Bramlett Place NW
- 2167 Unity Trail NW Unit 2
- 234 Unity Dr NW Unit 1
- 2136 Bramlett Place NW
- 2153 Unity Trail NW Unit 2
- 2156 Unity Trail NW
- 2169 Unity Trail NW
- 2133 Bramlett Place NW
- 2168 Unity Trail NW
- 2135 Unity Trail NW
- 2134 Bramlett Place NW