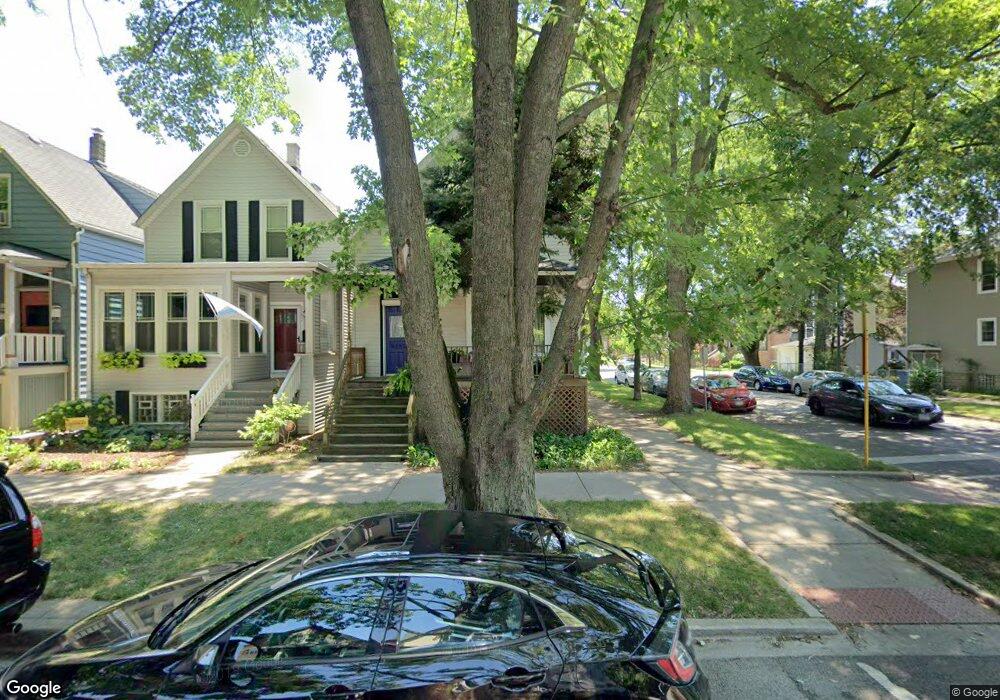
2159 W Cullom Ave Chicago, IL 60618
North Center NeighborhoodEstimated Value: $934,000 - $1,435,000
4
Beds
2
Baths
1,799
Sq Ft
$670/Sq Ft
Est. Value
About This Home
This home is located at 2159 W Cullom Ave, Chicago, IL 60618 and is currently estimated at $1,204,631, approximately $669 per square foot. 2159 W Cullom Ave is a home located in Cook County with nearby schools including Coonley Elementary School, Amundsen High School, and Pilgrim Lutheran School.
Ownership History
Date
Name
Owned For
Owner Type
Purchase Details
Closed on
Jun 7, 2021
Sold by
Zachar Elizabeth Lane
Bought by
Zachar Elizabeth Lane and Elizabeth Lane Zachar Trust
Current Estimated Value
Purchase Details
Closed on
Apr 24, 1998
Sold by
Weiss Joan A
Bought by
Zachar John P and Zachar Lane
Home Financials for this Owner
Home Financials are based on the most recent Mortgage that was taken out on this home.
Original Mortgage
$198,550
Outstanding Balance
$34,642
Interest Rate
7.2%
Estimated Equity
$1,169,989
Purchase Details
Closed on
Mar 4, 1998
Sold by
Drechsel Lorraine
Bought by
Weiss Joan A
Home Financials for this Owner
Home Financials are based on the most recent Mortgage that was taken out on this home.
Original Mortgage
$198,550
Outstanding Balance
$34,642
Interest Rate
7.2%
Estimated Equity
$1,169,989
Purchase Details
Closed on
Jun 22, 1995
Sold by
Weiss Joan A
Bought by
Weiss Joan A and The Joan A Weiss Trust
Create a Home Valuation Report for This Property
The Home Valuation Report is an in-depth analysis detailing your home's value as well as a comparison with similar homes in the area
Home Values in the Area
Average Home Value in this Area
Purchase History
| Date | Buyer | Sale Price | Title Company |
|---|---|---|---|
| Zachar Elizabeth Lane | -- | Attorney | |
| Zachar Elizabeth Lane | -- | Attorney | |
| Zachar John P | $209,000 | -- | |
| Weiss Joan A | -- | -- | |
| Weiss Joan A | -- | -- |
Source: Public Records
Mortgage History
| Date | Status | Borrower | Loan Amount |
|---|---|---|---|
| Open | Zachar John P | $198,550 |
Source: Public Records
Tax History
| Year | Tax Paid | Tax Assessment Tax Assessment Total Assessment is a certain percentage of the fair market value that is determined by local assessors to be the total taxable value of land and additions on the property. | Land | Improvement |
|---|---|---|---|---|
| 2025 | $13,293 | $83,528 | $34,286 | $49,242 |
| 2024 | $13,293 | $89,000 | $34,286 | $54,714 |
| 2023 | $12,937 | $66,318 | $27,675 | $38,643 |
| 2022 | $12,937 | $66,318 | $27,675 | $38,643 |
| 2021 | $15,249 | $79,162 | $27,675 | $51,487 |
| 2020 | $16,562 | $77,449 | $14,760 | $62,689 |
| 2019 | $16,410 | $85,109 | $14,760 | $70,349 |
| 2018 | $16,133 | $85,109 | $14,760 | $70,349 |
| 2017 | $11,797 | $58,174 | $12,915 | $45,259 |
| 2016 | $11,151 | $58,174 | $12,915 | $45,259 |
| 2015 | $10,179 | $58,174 | $12,915 | $45,259 |
| 2014 | $8,891 | $50,491 | $9,840 | $40,651 |
| 2013 | $8,705 | $50,491 | $9,840 | $40,651 |
Source: Public Records
Map
Nearby Homes
- 2143 W Berteau Ave
- 4222 N Claremont Ave
- 4114 N Bell Ave
- 4132 N Claremont Ave
- 4104 N Claremont Ave
- 4140 N Western Ave
- 4335 N Damen Ave
- 2335 W Belle Plaine Ave Unit 306
- 2442 W Berteau Ave
- 2034 W Sunnyside Ave
- 2159 W Wilson Ave
- 4125 N Campbell Ave
- 1903 W Berteau Ave
- 2024 W Irving Park Rd Unit 302
- 4159 N Maplewood Ave
- 4425 N Winchester Ave
- 4305 N Wolcott Ave
- 2149 W Eastwood Ave
- 3920 N Bell Ave
- 3944 N Claremont Ave Unit 408
- 2157 W Cullom Ave
- 2153 W Cullom Ave
- 2151 W Cullom Ave
- 2201 W Cullom Ave
- 2149 W Cullom Ave
- 4245 N Leavitt St
- 2147 W Cullom Ave Unit 21471
- 2147 W Cullom Ave Unit 21472
- 2147 W Cullom Ave Unit 1
- 4243 N Leavitt St
- 2205 W Cullom Ave Unit 2
- 2143 W Cullom Ave
- 2143 W Cullom Ave Unit G
- 2207 W Cullom Ave
- 4241 N Leavitt St
- 2150 W Cullom Ave Unit 2W
- 2150 W Cullom Ave
- 4244 N Leavitt St
- 2209 W Cullom Ave
- 4239 N Leavitt St
Your Personal Tour Guide
Ask me questions while you tour the home.