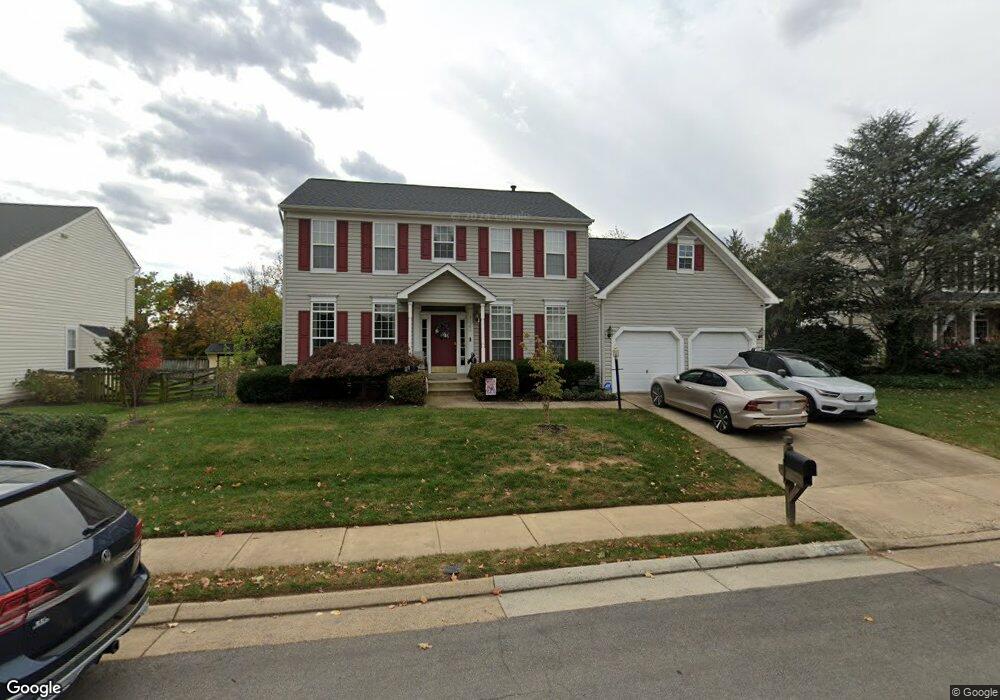
21595 Awbrey Place Broadlands, VA 20148
Estimated Value: $968,792 - $1,084,000
--
Bed
4
Baths
2,542
Sq Ft
$411/Sq Ft
Est. Value
About This Home
This home is located at 21595 Awbrey Place, Broadlands, VA 20148 and is currently estimated at $1,044,448, approximately $410 per square foot. 21595 Awbrey Place is a home located in Loudoun County with nearby schools including Hillside Elementary School, Eagle Ridge Middle School, and Briar Woods High School.
Ownership History
Date
Name
Owned For
Owner Type
Purchase Details
Closed on
Jun 2, 2021
Sold by
Garlock Charles B and Santos Joycelyn Agelica
Bought by
Santos Joycelyn Angelica
Current Estimated Value
Purchase Details
Closed on
Dec 3, 2002
Sold by
Prudential Relocation Inc
Bought by
Garlock Charles
Home Financials for this Owner
Home Financials are based on the most recent Mortgage that was taken out on this home.
Original Mortgage
$322,700
Outstanding Balance
$137,817
Interest Rate
6.16%
Mortgage Type
New Conventional
Estimated Equity
$906,631
Purchase Details
Closed on
Jun 2, 1998
Sold by
Washington Homes Inc Of Va
Bought by
Dotter Alan R and Dotter Marsha L
Home Financials for this Owner
Home Financials are based on the most recent Mortgage that was taken out on this home.
Original Mortgage
$197,600
Interest Rate
7.12%
Mortgage Type
New Conventional
Create a Home Valuation Report for This Property
The Home Valuation Report is an in-depth analysis detailing your home's value as well as a comparison with similar homes in the area
Home Values in the Area
Average Home Value in this Area
Purchase History
| Date | Buyer | Sale Price | Title Company |
|---|---|---|---|
| Santos Joycelyn Angelica | -- | None Available | |
| Garlock Charles | $425,000 | -- | |
| Dotter Alan R | $247,000 | -- |
Source: Public Records
Mortgage History
| Date | Status | Borrower | Loan Amount |
|---|---|---|---|
| Open | Garlock Charles | $322,700 | |
| Previous Owner | Dotter Alan R | $197,600 |
Source: Public Records
Tax History Compared to Growth
Tax History
| Year | Tax Paid | Tax Assessment Tax Assessment Total Assessment is a certain percentage of the fair market value that is determined by local assessors to be the total taxable value of land and additions on the property. | Land | Improvement |
|---|---|---|---|---|
| 2025 | $7,705 | $957,120 | $323,500 | $633,620 |
| 2024 | $7,738 | $894,560 | $308,500 | $586,060 |
| 2023 | $7,457 | $852,270 | $308,500 | $543,770 |
| 2022 | $7,145 | $802,840 | $268,500 | $534,340 |
| 2021 | $6,657 | $679,260 | $223,500 | $455,760 |
| 2020 | $6,636 | $641,120 | $203,500 | $437,620 |
| 2019 | $6,492 | $621,220 | $203,500 | $417,720 |
| 2018 | $6,551 | $603,820 | $178,500 | $425,320 |
| 2017 | $6,518 | $579,410 | $178,500 | $400,910 |
| 2016 | $6,408 | $559,620 | $0 | $0 |
| 2015 | $6,372 | $382,890 | $0 | $382,890 |
| 2014 | $6,257 | $363,230 | $0 | $363,230 |
Source: Public Records
Map
Nearby Homes
- 21563 Awbrey Place
- 21507 Tithables Cir
- 21518 Wild Timber Ct
- 21816 Ainsley Ct
- 42920 Cattail Meadows Place
- 21360 Shady Wood Terrace
- 43382 Farringdon Square
- 43376 Farringdon Square
- 40396 Milford Dr
- 43189 Riders Square
- 42623 Trappe Rock Ct
- 42612 Hardage Terrace
- 21752 Dollis Hill Terrace
- 21748 Dollis Hill Terrace
- 43497 Farringdon Square
- 21843 Beckhorn Station Terrace
- 21823 Beckhorn Station Terrace
- 43234 Farringdon Square
- 42577 Sunset Ridge Square
- Cameron 24-R1-RT Plan at Demott and Silver at Broadlands - Demott and Silver
- 21599 Awbrey Place
- 21594 Awbrey Place
- 21587 Awbrey Place
- 21603 Awbrey Place
- 21590 Awbrey Place
- 21598 Awbrey Place
- 42777 White Post Way
- 21586 Awbrey Place
- 42815 Oatyer Ct
- 21602 Awbrey Place
- 42811 Oatyer Ct
- 42758 Hollowind Ct
- 42750 Hollowind Ct
- 42648 Capitol View Terrace Unit 403
- 21647 Stillbrook Farm Dr
- 21546 Tithables Cir
- 21582 Awbrey Place
- 42807 Oatyer Ct
- 42746 Hollowind Ct
- 42762 Hollowind Ct