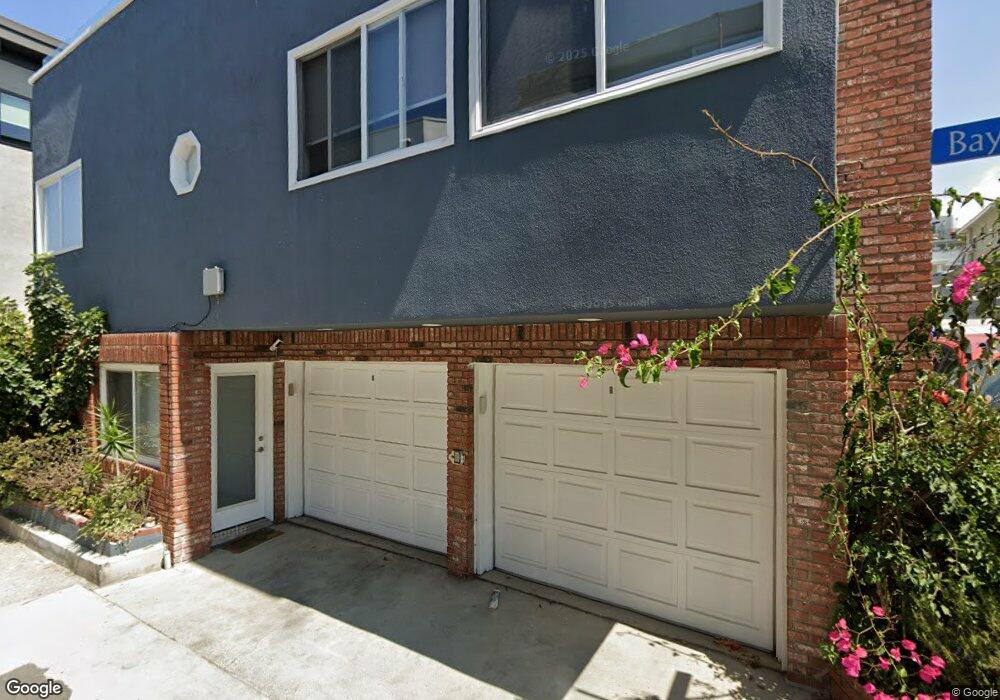
216 35th St Unit B Manhattan Beach, CA 90266
Estimated Value: $2,525,971 - $3,461,000
4
Beds
3
Baths
2,095
Sq Ft
$1,380/Sq Ft
Est. Value
About This Home
This home is located at 216 35th St Unit B, Manhattan Beach, CA 90266 and is currently estimated at $2,890,993, approximately $1,379 per square foot. 216 35th St Unit B is a home located in Los Angeles County with nearby schools including Grand View Elementary School, Manhattan Beach Middle School, and Mira Costa High School.
Ownership History
Date
Name
Owned For
Owner Type
Purchase Details
Closed on
Oct 28, 2010
Sold by
Burke Roger L and Burke Susan W
Bought by
Suerog Llc
Current Estimated Value
Home Financials for this Owner
Home Financials are based on the most recent Mortgage that was taken out on this home.
Original Mortgage
$197,325
Interest Rate
4.33%
Mortgage Type
New Conventional
Purchase Details
Closed on
May 19, 2003
Sold by
Burke Roger L and Burke Susan
Bought by
Suerog Llc
Purchase Details
Closed on
Feb 26, 2003
Sold by
Suerog Llc
Bought by
Burke Roger L
Home Financials for this Owner
Home Financials are based on the most recent Mortgage that was taken out on this home.
Original Mortgage
$383,000
Interest Rate
5.93%
Purchase Details
Closed on
Jan 28, 2002
Sold by
Burke Roger L and Burke Susan
Bought by
Suerog Llc
Create a Home Valuation Report for This Property
The Home Valuation Report is an in-depth analysis detailing your home's value as well as a comparison with similar homes in the area
Home Values in the Area
Average Home Value in this Area
Purchase History
| Date | Buyer | Sale Price | Title Company |
|---|---|---|---|
| Suerog Llc | -- | None Available | |
| Burke Roger L | -- | None Available | |
| Suerog Llc | -- | -- | |
| Burke Roger L | -- | Financial Title Company | |
| Suerog Llc | -- | -- |
Source: Public Records
Mortgage History
| Date | Status | Borrower | Loan Amount |
|---|---|---|---|
| Previous Owner | Burke Roger L | $197,325 | |
| Previous Owner | Burke Roger L | $383,000 |
Source: Public Records
Tax History
| Year | Tax Paid | Tax Assessment Tax Assessment Total Assessment is a certain percentage of the fair market value that is determined by local assessors to be the total taxable value of land and additions on the property. | Land | Improvement |
|---|---|---|---|---|
| 2025 | $8,967 | $766,127 | $478,523 | $287,604 |
| 2024 | $8,967 | $751,106 | $469,141 | $281,965 |
| 2023 | $8,933 | $736,380 | $459,943 | $276,437 |
| 2022 | $9,000 | $721,942 | $450,925 | $271,017 |
| 2021 | $8,902 | $707,787 | $442,084 | $265,703 |
| 2020 | $8,836 | $700,530 | $437,551 | $262,979 |
| 2019 | $8,703 | $686,795 | $428,972 | $257,823 |
| 2018 | $8,519 | $673,329 | $420,561 | $252,768 |
| 2016 | $7,914 | $647,184 | $404,231 | $242,953 |
| 2015 | $7,746 | $637,464 | $398,160 | $239,304 |
| 2014 | $7,667 | $624,978 | $390,361 | $234,617 |
Source: Public Records
Map
Nearby Homes
- 216 35th St Unit A
- 220 35th St
- 3419 Bayview Dr
- 224 35th St Unit B
- 224 35th St
- 224 35th St Unit C
- 224 35th St
- 3413 Bayview Dr
- 3416 Manhattan Ave
- 226 35th St
- 217 35th St
- 3420 Manhattan Ave Unit B
- 221 35th St
- 3418 Manhattan Ave
- 209 35th St
- 3414 Manhattan Ave
- 3412 Manhattan Ave
- 225 35th St
- 3408 Manhattan Ave
- 217 34th St
Your Personal Tour Guide
Ask me questions while you tour the home.