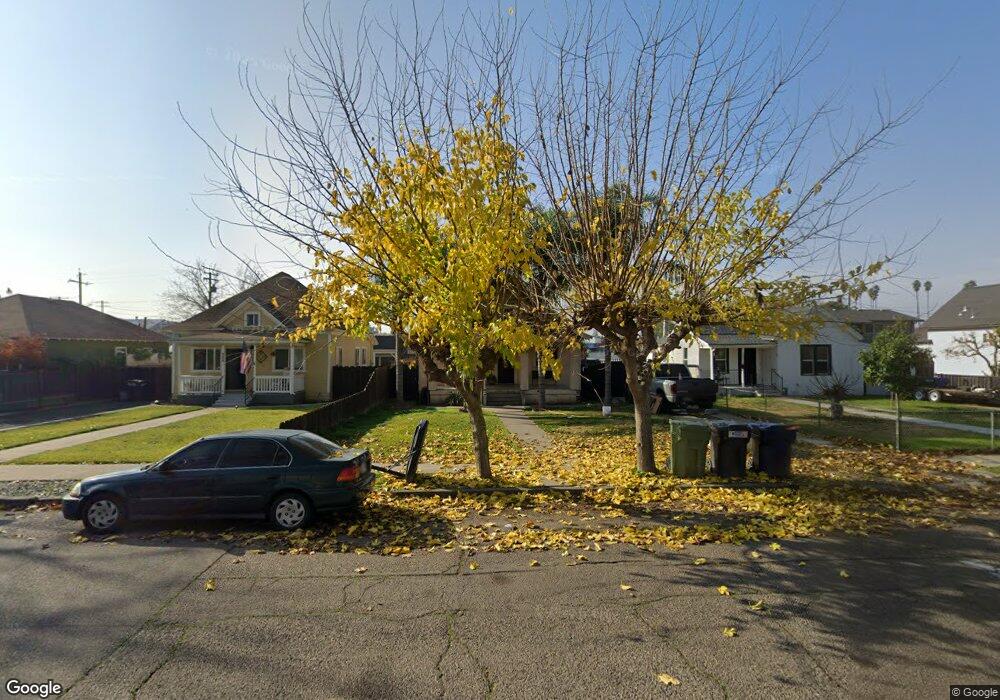
216 4th St Turlock, CA 95380
Downtown Turlock NeighborhoodEstimated Value: $340,000 - $609,000
3
Beds
2
Baths
1,204
Sq Ft
$363/Sq Ft
Est. Value
About This Home
This home is located at 216 4th St, Turlock, CA 95380 and is currently estimated at $437,401, approximately $363 per square foot. 216 4th St is a home located in Stanislaus County with nearby schools including Julien Elementary School, Marvin A. Dutcher Middle School, and Turlock Junior High School.
Ownership History
Date
Name
Owned For
Owner Type
Purchase Details
Closed on
Apr 21, 2006
Sold by
Carbajal Jose Luis
Bought by
Gonzalez Maria Teresa
Current Estimated Value
Home Financials for this Owner
Home Financials are based on the most recent Mortgage that was taken out on this home.
Original Mortgage
$202,000
Outstanding Balance
$123,874
Interest Rate
7.55%
Mortgage Type
Purchase Money Mortgage
Estimated Equity
$313,527
Purchase Details
Closed on
Oct 8, 1998
Sold by
Carrillo Jose Antonio
Bought by
Chavez Marie G
Create a Home Valuation Report for This Property
The Home Valuation Report is an in-depth analysis detailing your home's value as well as a comparison with similar homes in the area
Home Values in the Area
Average Home Value in this Area
Purchase History
| Date | Buyer | Sale Price | Title Company |
|---|---|---|---|
| Gonzalez Maria Teresa | -- | Alliance Title Company | |
| Gonzalez Maria Teresa | $190,000 | Alliance Title Company | |
| Chavez Marie G | -- | -- |
Source: Public Records
Mortgage History
| Date | Status | Borrower | Loan Amount |
|---|---|---|---|
| Open | Gonzalez Maria Teresa | $202,000 |
Source: Public Records
Tax History Compared to Growth
Tax History
| Year | Tax Paid | Tax Assessment Tax Assessment Total Assessment is a certain percentage of the fair market value that is determined by local assessors to be the total taxable value of land and additions on the property. | Land | Improvement |
|---|---|---|---|---|
| 2025 | $3,476 | $331,000 | $210,000 | $121,000 |
| 2024 | $3,458 | $329,000 | $183,000 | $146,000 |
| 2023 | $3,522 | $329,000 | $183,000 | $146,000 |
| 2022 | $3,421 | $317,500 | $183,000 | $134,500 |
| 2021 | $3,001 | $278,000 | $153,000 | $125,000 |
| 2020 | $2,356 | $219,000 | $125,000 | $94,000 |
| 2019 | $2,363 | $219,000 | $125,000 | $94,000 |
| 2018 | $2,272 | $207,000 | $110,000 | $97,000 |
| 2017 | $1,829 | $168,500 | $80,000 | $88,500 |
| 2016 | $1,677 | $162,500 | $50,000 | $112,500 |
| 2015 | $1,645 | $158,500 | $38,500 | $120,000 |
| 2014 | $1,284 | $124,000 | $30,000 | $94,000 |
Source: Public Records
Map
Nearby Homes