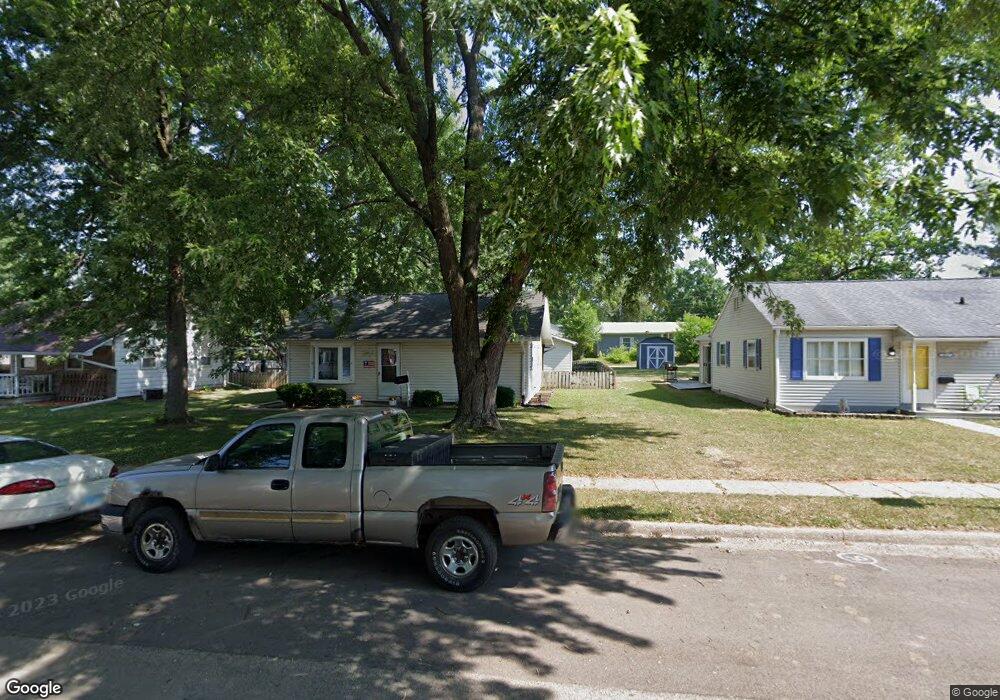
216 Cedar St Morrison, IL 61270
Estimated Value: $100,000 - $145,000
3
Beds
2
Baths
900
Sq Ft
$130/Sq Ft
Est. Value
About This Home
This home is located at 216 Cedar St, Morrison, IL 61270 and is currently estimated at $116,707, approximately $129 per square foot. 216 Cedar St is a home located in Whiteside County with nearby schools including Northside School, Southside School, and Morrison Junior High School.
Ownership History
Date
Name
Owned For
Owner Type
Purchase Details
Closed on
Jun 27, 2008
Sold by
Demay Thomas M and Demay Susan L
Bought by
Pohren Jason A and Pohren Daisha M
Current Estimated Value
Home Financials for this Owner
Home Financials are based on the most recent Mortgage that was taken out on this home.
Original Mortgage
$91,563
Outstanding Balance
$59,160
Interest Rate
6.1%
Mortgage Type
FHA
Estimated Equity
$57,547
Purchase Details
Closed on
Sep 26, 2006
Sold by
Demay Thomas M and Demay Susan L
Bought by
Demay Thomas M and Demay Susan L
Create a Home Valuation Report for This Property
The Home Valuation Report is an in-depth analysis detailing your home's value as well as a comparison with similar homes in the area
Home Values in the Area
Average Home Value in this Area
Purchase History
| Date | Buyer | Sale Price | Title Company |
|---|---|---|---|
| Pohren Jason A | $93,000 | None Available | |
| Demay Thomas M | -- | None Available |
Source: Public Records
Mortgage History
| Date | Status | Borrower | Loan Amount |
|---|---|---|---|
| Open | Pohren Jason A | $91,563 |
Source: Public Records
Tax History
| Year | Tax Paid | Tax Assessment Tax Assessment Total Assessment is a certain percentage of the fair market value that is determined by local assessors to be the total taxable value of land and additions on the property. | Land | Improvement |
|---|---|---|---|---|
| 2024 | $2,299 | $28,184 | $2,261 | $25,923 |
| 2023 | $2,143 | $25,659 | $2,058 | $23,601 |
| 2022 | $2,013 | $23,829 | $1,911 | $21,918 |
| 2021 | $1,961 | $23,334 | $1,871 | $21,463 |
| 2020 | $1,997 | $23,776 | $1,906 | $21,870 |
| 2019 | $2,222 | $26,188 | $1,974 | $24,214 |
| 2018 | $2,308 | $26,071 | $1,965 | $24,106 |
| 2017 | $2,144 | $25,045 | $1,888 | $23,157 |
| 2016 | $2,059 | $24,156 | $1,821 | $22,335 |
| 2015 | $2,159 | $24,747 | $1,866 | $22,881 |
| 2014 | $2,145 | $24,467 | $1,845 | $22,622 |
| 2013 | $2,159 | $24,747 | $1,866 | $22,881 |
Source: Public Records
Map
Nearby Homes
- 215 Cedar St
- 102 S Jackson St
- 101 N Jackson St
- 418 E Wall St
- 513 E Main St
- 403 E Park St
- 503 E Main St
- 503 Portland Ave
- 302 E Park St
- 400 E Knox St
- 509 S Madison St
- 109 E Morris St
- 308 S Genesee St
- 406 S Genesee St
- 507 Jenkran St Unit 4
- 301 S Genesee St
- 105 E Knox St
- 00 N Jackson St
- 208 Johnson St
- 523 Barden St
Your Personal Tour Guide
Ask me questions while you tour the home.