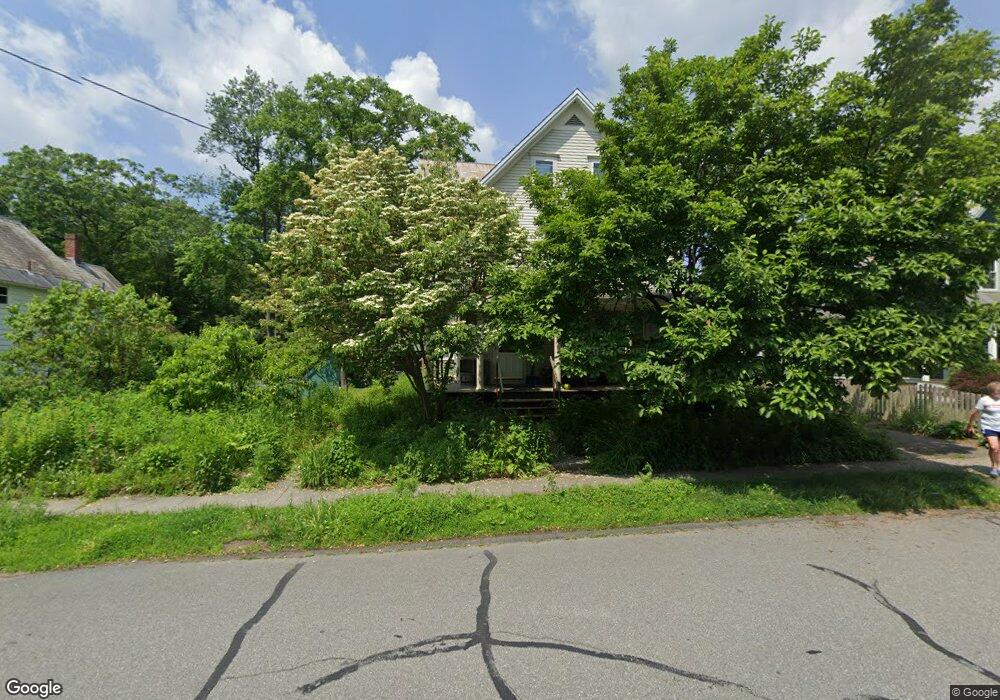
216 Davis St Greenfield, MA 01301
Estimated Value: $296,000 - $366,144
7
Beds
2
Baths
2,810
Sq Ft
$120/Sq Ft
Est. Value
About This Home
This home is located at 216 Davis St, Greenfield, MA 01301 and is currently estimated at $336,786, approximately $119 per square foot. 216 Davis St is a home located in Franklin County with nearby schools including Cornerstone Christian School and Holy Trinity School.
Ownership History
Date
Name
Owned For
Owner Type
Purchase Details
Closed on
Nov 21, 1995
Sold by
Mhfa
Bought by
Thompson John
Current Estimated Value
Home Financials for this Owner
Home Financials are based on the most recent Mortgage that was taken out on this home.
Original Mortgage
$93,500
Outstanding Balance
$1,299
Interest Rate
7.53%
Mortgage Type
Purchase Money Mortgage
Estimated Equity
$335,487
Purchase Details
Closed on
Sep 15, 1994
Sold by
Harley Isgur
Bought by
Mhfa
Purchase Details
Closed on
Dec 14, 1987
Sold by
Miklovich John P
Bought by
Isgur Harly
Create a Home Valuation Report for This Property
The Home Valuation Report is an in-depth analysis detailing your home's value as well as a comparison with similar homes in the area
Home Values in the Area
Average Home Value in this Area
Purchase History
| Date | Buyer | Sale Price | Title Company |
|---|---|---|---|
| Thompson John | $56,000 | -- | |
| Thompson John | $56,000 | -- | |
| Mhfa | $59,400 | -- | |
| Mhfa | $59,400 | -- | |
| Isgur Harly | $118,900 | -- |
Source: Public Records
Mortgage History
| Date | Status | Borrower | Loan Amount |
|---|---|---|---|
| Open | Isgur Harly | $93,500 | |
| Closed | Isgur Harly | $93,500 |
Source: Public Records
Tax History Compared to Growth
Tax History
| Year | Tax Paid | Tax Assessment Tax Assessment Total Assessment is a certain percentage of the fair market value that is determined by local assessors to be the total taxable value of land and additions on the property. | Land | Improvement |
|---|---|---|---|---|
| 2025 | $6,281 | $321,100 | $65,500 | $255,600 |
| 2024 | $6,239 | $306,000 | $52,500 | $253,500 |
| 2023 | $5,370 | $273,300 | $52,500 | $220,800 |
| 2022 | $4,930 | $220,900 | $47,600 | $173,300 |
| 2021 | $4,519 | $194,600 | $47,200 | $147,400 |
| 2020 | $4,366 | $190,400 | $43,000 | $147,400 |
| 2019 | $4,130 | $184,700 | $37,300 | $147,400 |
| 2018 | $4,049 | $180,500 | $36,600 | $143,900 |
| 2017 | $3,922 | $180,500 | $36,600 | $143,900 |
| 2016 | $4,024 | $184,500 | $35,200 | $149,300 |
| 2015 | $3,926 | $174,400 | $39,500 | $134,900 |
| 2014 | $3,582 | $174,500 | $39,500 | $135,000 |
Source: Public Records
Map
Nearby Homes