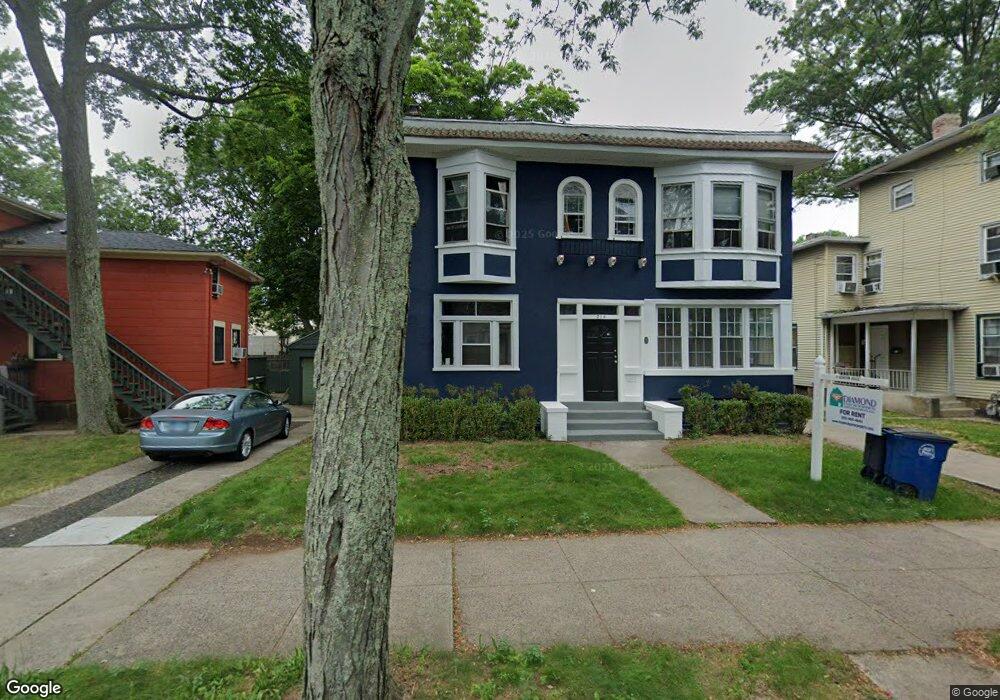
216 Dwight St New Haven, CT 06511
Dwight NeighborhoodEstimated Value: $383,000 - $807,000
4
Beds
3
Baths
2,650
Sq Ft
$225/Sq Ft
Est. Value
About This Home
This home is located at 216 Dwight St, New Haven, CT 06511 and is currently estimated at $596,695, approximately $225 per square foot. 216 Dwight St is a home located in New Haven County with nearby schools including Augusta Lewis Troup School, Amistad Academy, and Yeshiva Gedolah Rabbinical Inst.
Ownership History
Date
Name
Owned For
Owner Type
Purchase Details
Closed on
Jan 18, 2008
Sold by
Constitution Holding L
Bought by
Steinbach David
Current Estimated Value
Home Financials for this Owner
Home Financials are based on the most recent Mortgage that was taken out on this home.
Original Mortgage
$318,750
Interest Rate
6.02%
Purchase Details
Closed on
Oct 16, 2007
Sold by
American Home Mtg Llc
Bought by
Constitution Holding L
Home Financials for this Owner
Home Financials are based on the most recent Mortgage that was taken out on this home.
Original Mortgage
$280,260
Interest Rate
14%
Purchase Details
Closed on
Apr 6, 2005
Sold by
Stephens Crystal
Bought by
Foster Leonard
Purchase Details
Closed on
Dec 2, 2003
Sold by
Foster Deborah A
Bought by
Stephens Crystal
Purchase Details
Closed on
Feb 25, 2002
Sold by
Foster Christina
Bought by
Foster Deborah A
Purchase Details
Closed on
Feb 2, 1999
Sold by
Fleming Harold S and Fleming Arlene K
Bought by
Foster Christina
Create a Home Valuation Report for This Property
The Home Valuation Report is an in-depth analysis detailing your home's value as well as a comparison with similar homes in the area
Home Values in the Area
Average Home Value in this Area
Purchase History
| Date | Buyer | Sale Price | Title Company |
|---|---|---|---|
| Steinbach David | $425,000 | -- | |
| Constitution Holding L | $195,000 | -- | |
| Foster Leonard | $467,000 | -- | |
| Stephens Crystal | $390,000 | -- | |
| Foster Deborah A | $174,000 | -- | |
| Foster Christina | $84,000 | -- |
Source: Public Records
Mortgage History
| Date | Status | Borrower | Loan Amount |
|---|---|---|---|
| Open | Foster Christina | $423,328 | |
| Closed | Foster Christina | $318,750 | |
| Previous Owner | Foster Christina | $280,260 |
Source: Public Records
Tax History
| Year | Tax Paid | Tax Assessment Tax Assessment Total Assessment is a certain percentage of the fair market value that is determined by local assessors to be the total taxable value of land and additions on the property. | Land | Improvement |
|---|---|---|---|---|
| 2025 | $14,593 | $370,370 | $119,000 | $251,370 |
| 2024 | $14,259 | $370,370 | $119,000 | $251,370 |
| 2023 | $13,778 | $370,370 | $119,000 | $251,370 |
| 2022 | $14,722 | $370,370 | $119,000 | $251,370 |
| 2021 | $9,113 | $207,690 | $14,630 | $193,060 |
| 2020 | $9,113 | $207,690 | $14,630 | $193,060 |
| 2019 | $8,927 | $207,690 | $14,630 | $193,060 |
| 2018 | $8,927 | $207,690 | $14,630 | $193,060 |
| 2017 | $8,033 | $207,690 | $14,630 | $193,060 |
| 2016 | $8,531 | $205,310 | $17,570 | $187,740 |
| 2015 | $8,531 | $205,310 | $17,570 | $187,740 |
| 2014 | $8,531 | $205,310 | $17,570 | $187,740 |
Source: Public Records
Map
Nearby Homes
- 516 Elm St
- 358 Orchard St
- 100 York St Unit 12-E
- 100 York St Unit 3B
- 100 York St Unit 5-D
- 100 York St Unit 9-C
- 100 York St Unit 5G
- 100 York St Unit 15-M
- 100 York St Unit 5B
- 607 Elm St
- 189 Sherman Ave Unit 17
- 635 Elm St
- 1455 Chapel St
- 15 Maple St
- 290 Sherman Ave
- 666 Orchard St
- 143 County St
- 49 Carmel St
- 55 Carmel St
- 80 Admiral St
- 222 Dwight St
- 91 Edgewood Ave
- 226 Dwight St
- 228 Dwight St
- 99 Edgewood Ave
- 232 Dwight St
- 215 Dwight St
- 217 Dwight St
- 219 Dwight St
- 219 Dwight St Unit 2
- 229 Dwight St
- 229 Dwight St Unit 2
- 229 Dwight St Unit 1
- 223 Dwight St
- 227 Dwight St
- 75 Edgewood Ave
- 203 Dwight St
- 194 Dwight St Unit 3
- 194 Dwight St Unit G
- 192 Dwight St
Your Personal Tour Guide
Ask me questions while you tour the home.