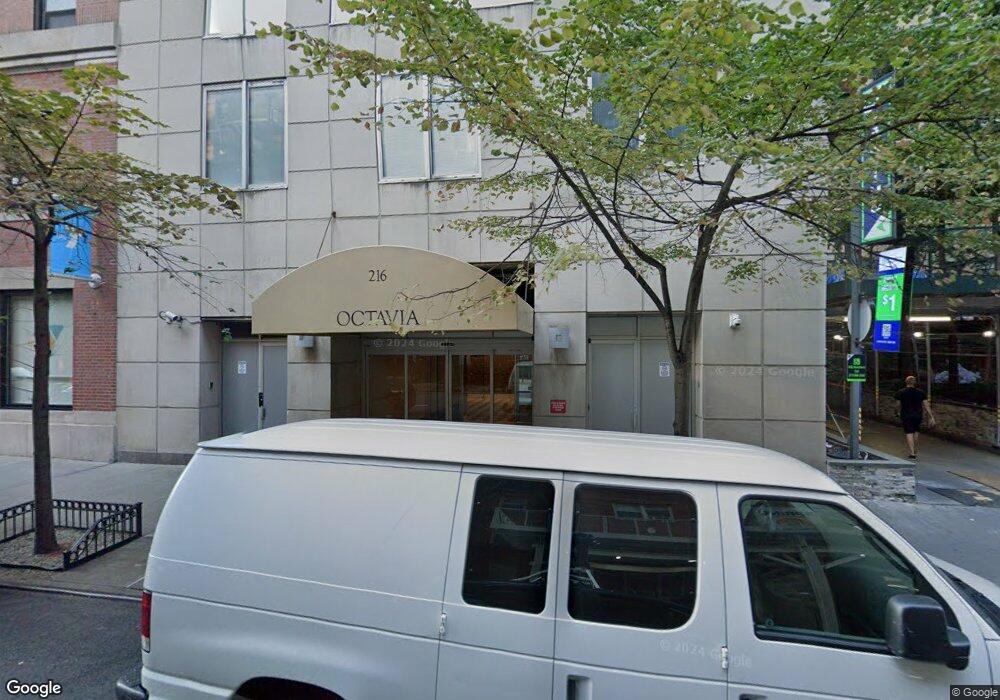
216 E 47th St Unit 218 New York, NY 10017
Turtle Bay NeighborhoodEstimated Value: $891,000 - $1,403,000
--
Bed
--
Bath
801
Sq Ft
$1,403/Sq Ft
Est. Value
About This Home
This home is located at 216 E 47th St Unit 218, New York, NY 10017 and is currently estimated at $1,123,750, approximately $1,402 per square foot. 216 E 47th St Unit 218 is a home located in New York County with nearby schools including P.S. 116 Mary Lindley Murray, Simon Baruch Middle School 104, and Clinton School.
Ownership History
Date
Name
Owned For
Owner Type
Purchase Details
Closed on
Apr 1, 2016
Sold by
Li Wah Fai
Bought by
Chen Xiu Min and Zheng Shou S
Current Estimated Value
Purchase Details
Closed on
Mar 28, 2011
Sold by
Chow Tut-Sang and Wu Angela
Bought by
Li Wah Fai
Home Financials for this Owner
Home Financials are based on the most recent Mortgage that was taken out on this home.
Original Mortgage
$325,000
Interest Rate
4.99%
Mortgage Type
Purchase Money Mortgage
Purchase Details
Closed on
Aug 28, 2007
Sold by
Nambu Inc
Bought by
Chow Tut-Sang and Wu Angela
Home Financials for this Owner
Home Financials are based on the most recent Mortgage that was taken out on this home.
Original Mortgage
$500,000
Interest Rate
6.74%
Mortgage Type
Purchase Money Mortgage
Create a Home Valuation Report for This Property
The Home Valuation Report is an in-depth analysis detailing your home's value as well as a comparison with similar homes in the area
Home Values in the Area
Average Home Value in this Area
Purchase History
| Date | Buyer | Sale Price | Title Company |
|---|---|---|---|
| Chen Xiu Min | $830,000 | -- | |
| Li Wah Fai | $650,000 | -- | |
| Chow Tut-Sang | $685,000 | -- |
Source: Public Records
Mortgage History
| Date | Status | Borrower | Loan Amount |
|---|---|---|---|
| Previous Owner | Li Wah Fai | $325,000 | |
| Previous Owner | Chow Tut-Sang | $500,000 |
Source: Public Records
Tax History Compared to Growth
Tax History
| Year | Tax Paid | Tax Assessment Tax Assessment Total Assessment is a certain percentage of the fair market value that is determined by local assessors to be the total taxable value of land and additions on the property. | Land | Improvement |
|---|---|---|---|---|
| 2025 | $19,215 | $163,509 | $24,347 | $139,162 |
| 2024 | $19,215 | $153,695 | $24,347 | $129,348 |
| 2023 | $17,916 | $146,053 | $24,347 | $121,706 |
| 2022 | $16,979 | $143,856 | $24,347 | $119,509 |
| 2021 | $17,215 | $142,140 | $24,347 | $117,793 |
| 2020 | $17,173 | $152,084 | $24,347 | $127,737 |
| 2019 | $16,726 | $152,636 | $24,347 | $128,289 |
| 2018 | $16,207 | $156,689 | $24,347 | $132,342 |
| 2017 | $15,019 | $140,260 | $24,347 | $115,913 |
| 2016 | $14,182 | $128,893 | $24,348 | $104,545 |
| 2015 | $8,295 | $113,688 | $24,347 | $89,341 |
| 2014 | $8,295 | $107,048 | $24,347 | $82,701 |
Source: Public Records
Map
Nearby Homes
- 240 E 47th St Unit 19B
- 240 E 47th St Unit 9B
- 240 E 47th St Unit 39AB
- 240 E 46th St Unit 8H
- 240 E 46th St Unit 6G
- 240 E 46th St Unit 10H
- 240 E 46th St Unit 1D
- 234 E 46th St Unit 201
- 234 E 46th St Unit 2103
- 234 E 46th St Unit 1202
- 234 E 46th St Unit 602
- 234 E 46th St Unit 803
- 234 E 46th St Unit 301
- 234 E 46th St Unit 1402
- 234 E 46th St Unit PH2104
- 234 E 46th St Unit 1201
- 234 E 46th St Unit 802
- 234 E 46th St Unit 1904
- 234 E 46th St Unit 904
- 234 E 46th St Unit 1704
- 216 E 47th St Unit 218
- 216 E 47th St Unit 218
- 216 E 47th St Unit 218
- 216 E 47th St Unit 218
- 216 E 47th St Unit 218
- 216 E 47th St Unit 218
- 216 E 47th St Unit 218
- 216 E 47th St Unit 218
- 216 E 47th St Unit 218
- 216 E 47th St Unit 218
- 216 E 47th St Unit 218
- 216 E 47th St Unit 218
- 216 E 47th St Unit 218
- 216 E 47th St Unit 218
- 216 E 47th St Unit 218
- 216 E 47th St Unit 218
- 216 E 47th St Unit 218
- 216 E 47th St Unit 218
- 216 E 47th St Unit 218
- 216 E 47th St Unit 218