Estimated Value: $229,843 - $272,000
3
Beds
2
Baths
1,563
Sq Ft
$160/Sq Ft
Est. Value
About This Home
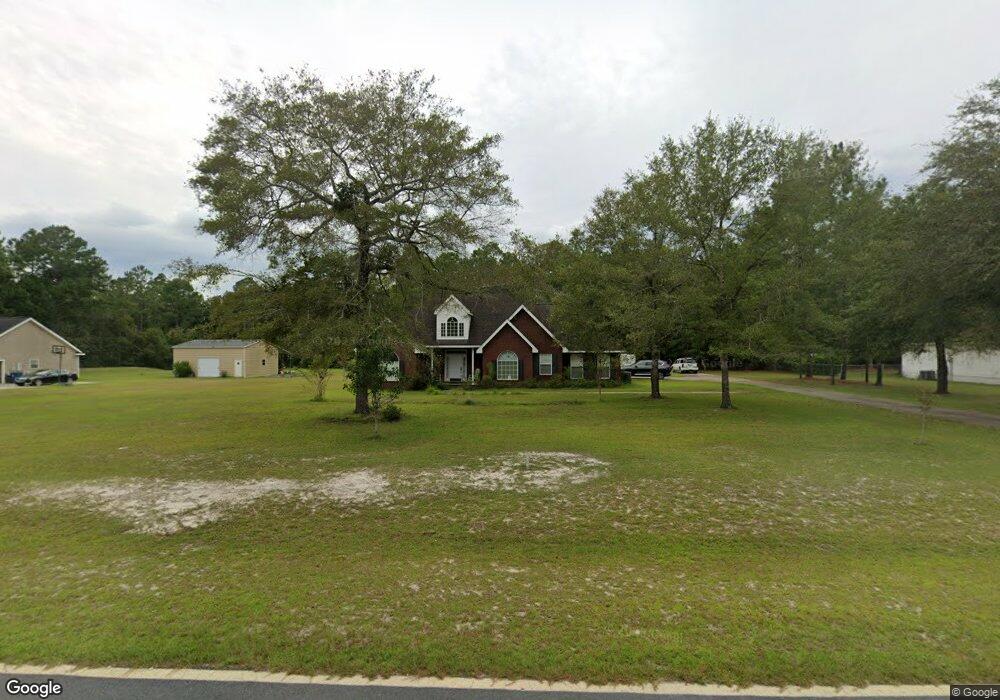
This home is located at 216 Horse Ranch Rd, Jesup, GA 31545 and is currently estimated at $249,961, approximately $159 per square foot. 216 Horse Ranch Rd is a home located in Wayne County with nearby schools including Martha Rawls Smith Elementary School, Arthur Williams Middle School, and Wayne County High School.
Ownership History
Date
Name
Owned For
Owner Type
Purchase Details
Closed on
Jul 26, 2012
Sold by
Kirkpatrick Kenneth Roger
Bought by
Kirkpatric Kenneth Jana
Current Estimated Value
Purchase Details
Closed on
Jun 15, 2010
Sold by
Dehaven Mary Alice
Bought by
Kirkpatric Kenneth Roger and Kirkpatrick Jana Kay
Home Financials for this Owner
Home Financials are based on the most recent Mortgage that was taken out on this home.
Original Mortgage
$143,000
Interest Rate
4.83%
Mortgage Type
VA
Purchase Details
Closed on
Aug 12, 2005
Sold by
Arthur Thomas Dean
Bought by
Dehaven Mark P and Dehaven Mary Alice
Home Financials for this Owner
Home Financials are based on the most recent Mortgage that was taken out on this home.
Original Mortgage
$57,000
Interest Rate
5.61%
Mortgage Type
New Conventional
Purchase Details
Closed on
Apr 1, 2003
Bought by
Arthur Thomas Dean
Create a Home Valuation Report for This Property
The Home Valuation Report is an in-depth analysis detailing your home's value as well as a comparison with similar homes in the area
Home Values in the Area
Average Home Value in this Area
Purchase History
| Date | Buyer | Sale Price | Title Company |
|---|---|---|---|
| Kirkpatric Kenneth Jana | -- | -- | |
| Kirkpatric Kenneth Roger | $143,000 | -- | |
| Dehaven Mark P | $142,250 | -- | |
| Arthur Thomas Dean | $125,000 | -- |
Source: Public Records
Mortgage History
| Date | Status | Borrower | Loan Amount |
|---|---|---|---|
| Previous Owner | Kirkpatric Kenneth Roger | $143,000 | |
| Previous Owner | Dehaven Mark P | $57,000 |
Source: Public Records
Tax History Compared to Growth
Tax History
| Year | Tax Paid | Tax Assessment Tax Assessment Total Assessment is a certain percentage of the fair market value that is determined by local assessors to be the total taxable value of land and additions on the property. | Land | Improvement |
|---|---|---|---|---|
| 2024 | $1,018 | $88,330 | $5,750 | $82,580 |
| 2023 | $2,250 | $74,993 | $2,562 | $72,431 |
| 2022 | $697 | $51,730 | $2,562 | $49,168 |
| 2021 | $760 | $51,730 | $2,562 | $49,168 |
| 2020 | $831 | $54,081 | $4,913 | $49,168 |
| 2019 | $880 | $54,081 | $4,913 | $49,168 |
| 2018 | $880 | $54,081 | $4,913 | $49,168 |
| 2017 | $634 | $54,081 | $4,913 | $49,168 |
| 2016 | $585 | $54,080 | $4,913 | $49,168 |
| 2014 | $584 | $54,080 | $4,913 | $49,168 |
| 2013 | -- | $54,079 | $4,912 | $49,167 |
Source: Public Records
Map
Nearby Homes
- 177 Bunion Rd
- 71 Cruz Rd
- 1276 Spring Grove Rd
- 368 Whispering Pines Rd
- 15 Paris Dr
- 120 Womack Rd Unit 1.4 ACRES
- 440 Oak Island Estates Rd
- 75 Woodlawn Dr
- 196 Pine Ridge Rd
- 308 Cowboy Rd
- 2 Common Way
- 186 Community Cir
- 1275 Rayonier Rd
- Lot 1,2,3 Rayonier Rd
- 143 Caleb Cir
- na Georgia 169
- 1 Spring Grove Rd
- 695 Lanes Bridge Rd
- 1 Palm Island Cir
- 0 Palm Island Cir
- 252 Horse Ranch Rd
- 156 Horse Ranch Rd
- 203 Horse Ranch Rd
- 233 Horse Ranch Rd
- 181 Horse Ranch Rd
- 260 Horse Ranch Rd
- 0 Horse Ranch Rd Unit 18390
- 253 Horse Ranch Rd
- 138 Horse Ranch Rd
- 125 Horse Ranch Rd
- 106 Horse Ranch Rd
- 85 Horse Ranch Rd
- 104 Sooner Dr
- 82 Horse Ranch Rd
- 54 Sooner Dr
- 2050 Lanes Bridge Rd
- 311 Tyre Rd
- 283 Tyre Rd
- 270 Sooner Dr
- 100 Tyre Rd