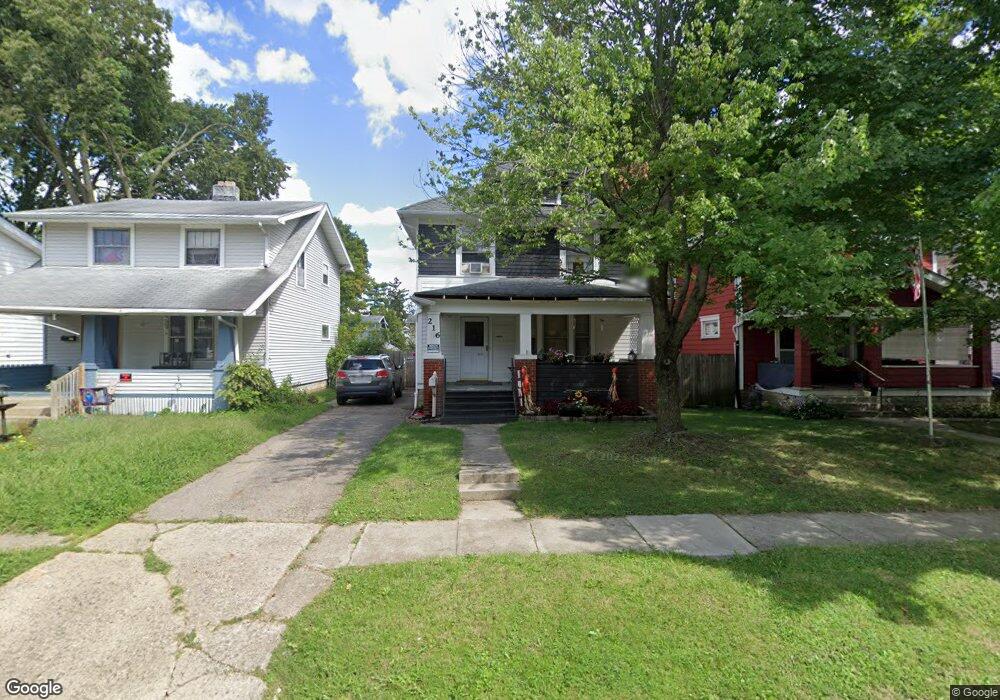
216 N Warren Ave Columbus, OH 43204
North Hilltop NeighborhoodEstimated Value: $167,000 - $196,000
4
Beds
2
Baths
1,632
Sq Ft
$112/Sq Ft
Est. Value
About This Home
This home is located at 216 N Warren Ave, Columbus, OH 43204 and is currently estimated at $183,244, approximately $112 per square foot. 216 N Warren Ave is a home located in Franklin County with nearby schools including West Broad Elementary School, Westmoor Middle School, and West High School.
Ownership History
Date
Name
Owned For
Owner Type
Purchase Details
Closed on
Jun 17, 2024
Sold by
Morgan Joseph E
Bought by
Morgan Tracey L and Morgan Joseph E
Current Estimated Value
Purchase Details
Closed on
Aug 4, 2009
Sold by
Estate Of Irma M Morgan
Bought by
Morgan John D
Purchase Details
Closed on
Sep 3, 1969
Bought by
Morgan John D and Morgan Irma
Create a Home Valuation Report for This Property
The Home Valuation Report is an in-depth analysis detailing your home's value as well as a comparison with similar homes in the area
Home Values in the Area
Average Home Value in this Area
Purchase History
| Date | Buyer | Sale Price | Title Company |
|---|---|---|---|
| Morgan Tracey L | -- | None Listed On Document | |
| Morgan John D | -- | None Available | |
| Morgan John D | -- | -- |
Source: Public Records
Tax History Compared to Growth
Tax History
| Year | Tax Paid | Tax Assessment Tax Assessment Total Assessment is a certain percentage of the fair market value that is determined by local assessors to be the total taxable value of land and additions on the property. | Land | Improvement |
|---|---|---|---|---|
| 2024 | $2,152 | $47,960 | $5,570 | $42,390 |
| 2023 | $1,719 | $47,950 | $5,565 | $42,385 |
| 2022 | $963 | $27,310 | $2,000 | $25,310 |
| 2021 | $964 | $27,310 | $2,000 | $25,310 |
| 2020 | $966 | $27,310 | $2,000 | $25,310 |
| 2019 | $860 | $22,930 | $1,680 | $21,250 |
| 2018 | $862 | $22,930 | $1,680 | $21,250 |
| 2017 | $860 | $22,930 | $1,680 | $21,250 |
| 2016 | $953 | $23,140 | $4,200 | $18,940 |
| 2015 | $865 | $23,140 | $4,200 | $18,940 |
| 2014 | $867 | $23,140 | $4,200 | $18,940 |
| 2013 | $549 | $27,195 | $4,935 | $22,260 |
Source: Public Records
Map
Nearby Homes
- 200-202 N Harris Ave
- 166 N Harris Ave
- 118 N Ogden Ave
- 127 N Burgess Ave
- 298 N Burgess Ave
- 87 N Warren Ave
- 104-106 N Hague Ave
- 78 N Burgess Ave
- 75 N Terrace Ave
- 149 N Eureka Ave
- 188 N Eureka Ave
- 120 N Eureka Ave Unit 122
- 285 N Wayne Ave
- 2578 Elliott Ave
- 184 N Roys Ave
- 162 S Roys Ave
- 274 N Wayne Ave
- 65 N Chase Ave
- 146 N Wayne Ave
- 2360 Westwood Dr
- 212 N Warren Ave
- 222 N Warren Ave
- 206 N Warren Ave
- 200 N Warren Ave
- 232 N Warren Ave Unit 234
- 217 N Ogden Ave
- 221 N Ogden Ave
- 238 N Warren Ave
- 196 N Warren Ave
- 211 N Ogden Ave
- 227 N Ogden Ave
- 217 N Warren Ave
- 211 N Warren Ave
- 233 N Ogden Ave
- 205 N Ogden Ave
- 221 N Warren Ave
- 205 N Warren Ave
- 242-244 N Warren Ave
- 227 N Warren Ave
- 190 N Warren Ave