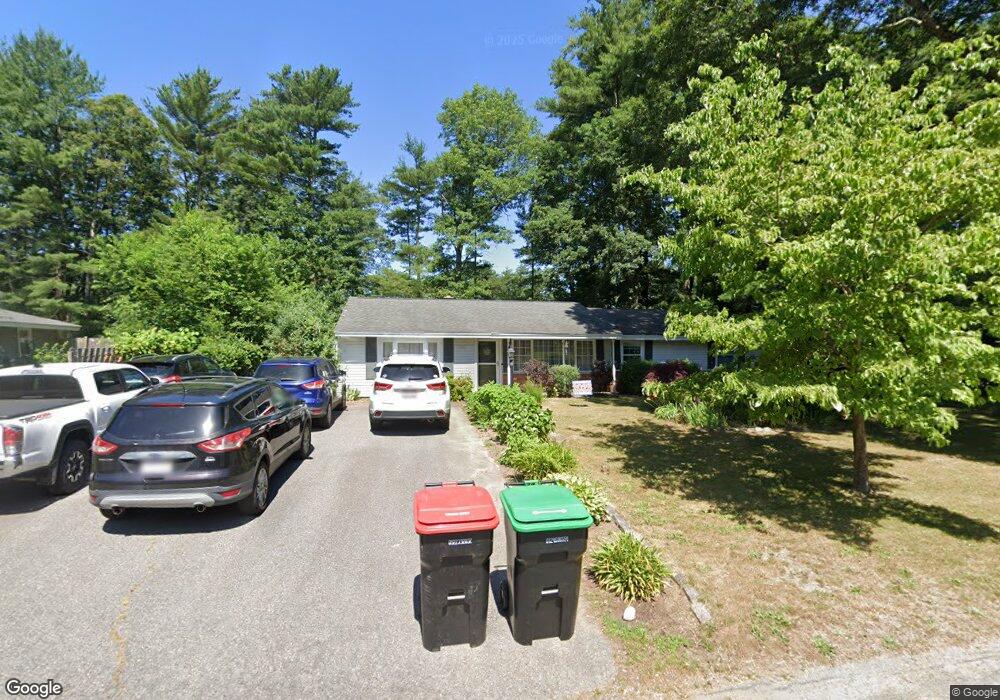
216 Nicholas Rd Raynham, MA 02767
Estimated Value: $514,000 - $560,000
4
Beds
2
Baths
1,504
Sq Ft
$355/Sq Ft
Est. Value
About This Home
This home is located at 216 Nicholas Rd, Raynham, MA 02767 and is currently estimated at $534,028, approximately $355 per square foot. 216 Nicholas Rd is a home located in Bristol County with nearby schools including Merrill Elementary School, LaLiberte Elementary School, and Williams Intermediate School.
Ownership History
Date
Name
Owned For
Owner Type
Purchase Details
Closed on
Apr 29, 2010
Sold by
Maclary Richard D
Bought by
Marvel Heather A
Current Estimated Value
Home Financials for this Owner
Home Financials are based on the most recent Mortgage that was taken out on this home.
Original Mortgage
$157,000
Outstanding Balance
$103,289
Interest Rate
4.99%
Mortgage Type
Purchase Money Mortgage
Estimated Equity
$430,739
Purchase Details
Closed on
Dec 2, 2005
Sold by
Dacey Peter and Dacey Tammy L
Bought by
Maclary Richard D
Home Financials for this Owner
Home Financials are based on the most recent Mortgage that was taken out on this home.
Original Mortgage
$244,000
Interest Rate
6.14%
Mortgage Type
Purchase Money Mortgage
Purchase Details
Closed on
Aug 31, 1998
Sold by
Reed Pauline M and Schettini Pauline
Bought by
Dacey Peter and Dacey Tammy L
Create a Home Valuation Report for This Property
The Home Valuation Report is an in-depth analysis detailing your home's value as well as a comparison with similar homes in the area
Home Values in the Area
Average Home Value in this Area
Purchase History
| Date | Buyer | Sale Price | Title Company |
|---|---|---|---|
| Marvel Heather A | $215,000 | -- | |
| Maclary Richard D | $305,000 | -- | |
| Dacey Peter | $125,000 | -- |
Source: Public Records
Mortgage History
| Date | Status | Borrower | Loan Amount |
|---|---|---|---|
| Open | Marvel Heather A | $157,000 | |
| Closed | Dacey Peter | $43,000 | |
| Previous Owner | Maclary Richard D | $244,000 | |
| Previous Owner | Dacey Peter | $160,000 |
Source: Public Records
Tax History
| Year | Tax Paid | Tax Assessment Tax Assessment Total Assessment is a certain percentage of the fair market value that is determined by local assessors to be the total taxable value of land and additions on the property. | Land | Improvement |
|---|---|---|---|---|
| 2025 | $5,581 | $461,200 | $207,600 | $253,600 |
| 2024 | $5,337 | $429,700 | $188,800 | $240,900 |
| 2023 | $4,983 | $366,400 | $169,900 | $196,500 |
| 2022 | $4,866 | $328,100 | $160,400 | $167,700 |
| 2021 | $4,597 | $312,900 | $151,000 | $161,900 |
| 2020 | $4,366 | $303,000 | $143,500 | $159,500 |
| 2019 | $4,177 | $293,500 | $134,000 | $159,500 |
| 2018 | $3,946 | $264,800 | $126,500 | $138,300 |
| 2017 | $3,700 | $246,200 | $120,800 | $125,400 |
| 2016 | $3,631 | $242,400 | $117,000 | $125,400 |
| 2015 | $3,397 | $222,900 | $122,000 | $100,900 |
Source: Public Records
Map
Nearby Homes
- 30 Edward Rd
- 21 Sully Rd
- 53 Queens Cir
- 935 King St
- 26 Nottingham Dr
- 201 Buck Knoll Rd
- 33 White St
- 162 Bayberry Rd
- 224 Whippoorwill Dr
- 35 Spruce St
- 30 Spruce St
- 678 Pine St
- 84 Diniz Dr
- 698 Pine St
- 75 Warren St W Unit 16
- 0 Pine St Unit 73492996
- 858 Pine St Unit Model
- 5 Jaclyn Way
- 2 Maplewood Ln Unit 21-1
- 0 Maplewood Unit 21.3 73426136
- 206 Nicholas Rd
- 228 Nicholas Rd
- 62 Francine Rd
- 50 Francine Rd
- 72 Francine Rd
- 236 Nicholas Rd
- 215 Nicholas Rd
- 190 Nicholas Rd
- 225 Nicholas Rd
- 205 Nicholas Rd
- 42 Francine Rd
- 82 Francine Rd
- 235 Nicholas Rd
- 246 Nicholas Rd
- 197 Nicholas Rd
- 188 Nicholas Rd
- 32 Francine Rd
- 245 Nicholas Rd
- 58 Francine Rd
- 142 Eleanor Rd
Your Personal Tour Guide
Ask me questions while you tour the home.