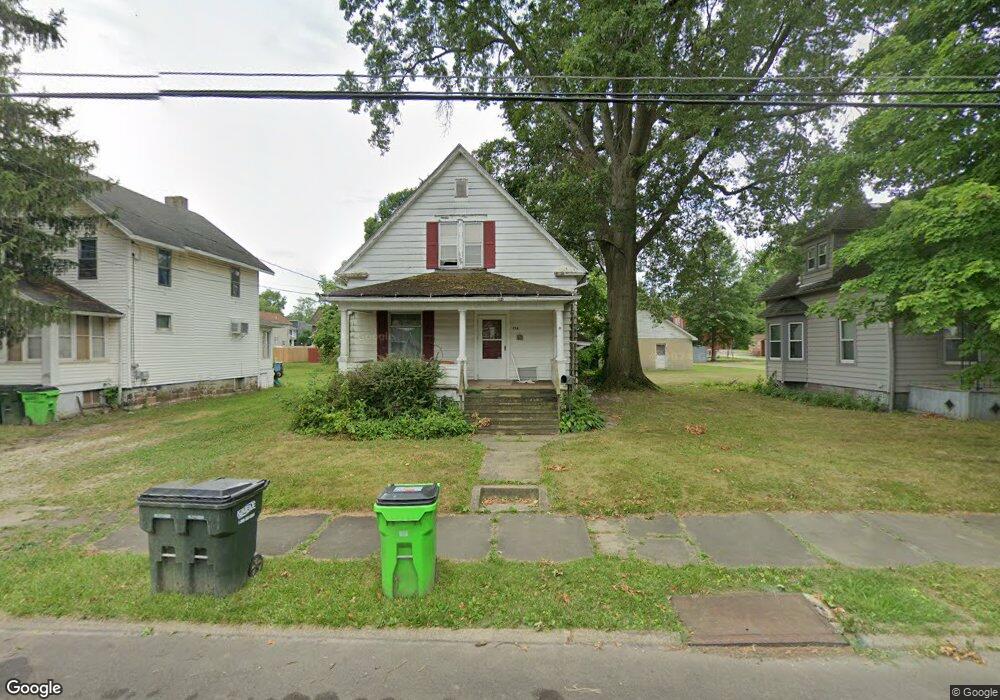
216 Selby St Alliance, OH 44601
Estimated Value: $78,000 - $91,066
2
Beds
1
Bath
936
Sq Ft
$91/Sq Ft
Est. Value
About This Home
This home is located at 216 Selby St, Alliance, OH 44601 and is currently estimated at $85,517, approximately $91 per square foot. 216 Selby St is a home located in Stark County with nearby schools including Alliance Early Learning School, Alliance Intermediate School at Northside, and Alliance Middle School.
Ownership History
Date
Name
Owned For
Owner Type
Purchase Details
Closed on
Sep 25, 2014
Sold by
Stonecrest Income And Opportunity Fund I
Bought by
Rocktop Partners 1 Lp
Current Estimated Value
Purchase Details
Closed on
Jan 2, 2013
Sold by
Springleag Fincial Services Of Ohio
Bought by
Stonecrest Income And Oppurity Fund Llc
Purchase Details
Closed on
Apr 14, 2010
Sold by
Lloyd Jessica
Bought by
Lloyd Jessica and Lloyd Charles
Purchase Details
Closed on
Nov 10, 2006
Sold by
Courtney Robert
Bought by
Lloyd Jessica
Purchase Details
Closed on
Jul 11, 1988
Create a Home Valuation Report for This Property
The Home Valuation Report is an in-depth analysis detailing your home's value as well as a comparison with similar homes in the area
Home Values in the Area
Average Home Value in this Area
Purchase History
| Date | Buyer | Sale Price | Title Company |
|---|---|---|---|
| Rocktop Partners 1 Lp | $24,235 | None Available | |
| Stonecrest Income And Oppurity Fund Llc | $9,000 | None Available | |
| Lloyd Jessica | -- | Attorney | |
| Lloyd Jessica | -- | Attorney | |
| -- | $27,500 | -- |
Source: Public Records
Tax History Compared to Growth
Tax History
| Year | Tax Paid | Tax Assessment Tax Assessment Total Assessment is a certain percentage of the fair market value that is determined by local assessors to be the total taxable value of land and additions on the property. | Land | Improvement |
|---|---|---|---|---|
| 2025 | $5,770 | $19,050 | $5,570 | $13,480 |
| 2024 | $4,706 | $19,050 | $5,570 | $13,480 |
| 2023 | $4,583 | $16,520 | $5,530 | $10,990 |
| 2022 | $684 | $16,520 | $5,530 | $10,990 |
| 2021 | $686 | $16,520 | $5,530 | $10,990 |
| 2020 | $612 | $13,760 | $4,800 | $8,960 |
| 2019 | $604 | $13,770 | $4,800 | $8,970 |
| 2018 | $607 | $13,770 | $4,800 | $8,970 |
| 2017 | $749 | $10,680 | $3,220 | $7,460 |
| 2016 | $483 | $10,680 | $3,220 | $7,460 |
| 2015 | $272 | $11,910 | $3,220 | $8,690 |
| 2014 | $601 | $12,540 | $3,470 | $9,070 |
| 2013 | $300 | $12,540 | $3,470 | $9,070 |
Source: Public Records
Map
Nearby Homes
- 124 E Wayne St
- 710 N Freedom Ave
- 511 W Ely St
- 329 1/2 W Main St
- 163 W Market St
- 345 W Market St
- 132 S Haines Ave
- 000 Meadowbrook Ave
- 0 Meadowbrook Ave
- 11344 Walnut Ave NE
- 361 E Main St
- 432 Johnson Ave
- 652 N Webb Ave
- 427 S Union Ave
- 0 Homestead Ave NE
- 356 E Broadway St
- 142 S Seneca Ave
- 000 Klinger Ave
- 14723 Bolton St NE
- 11310 Webb Ave NE