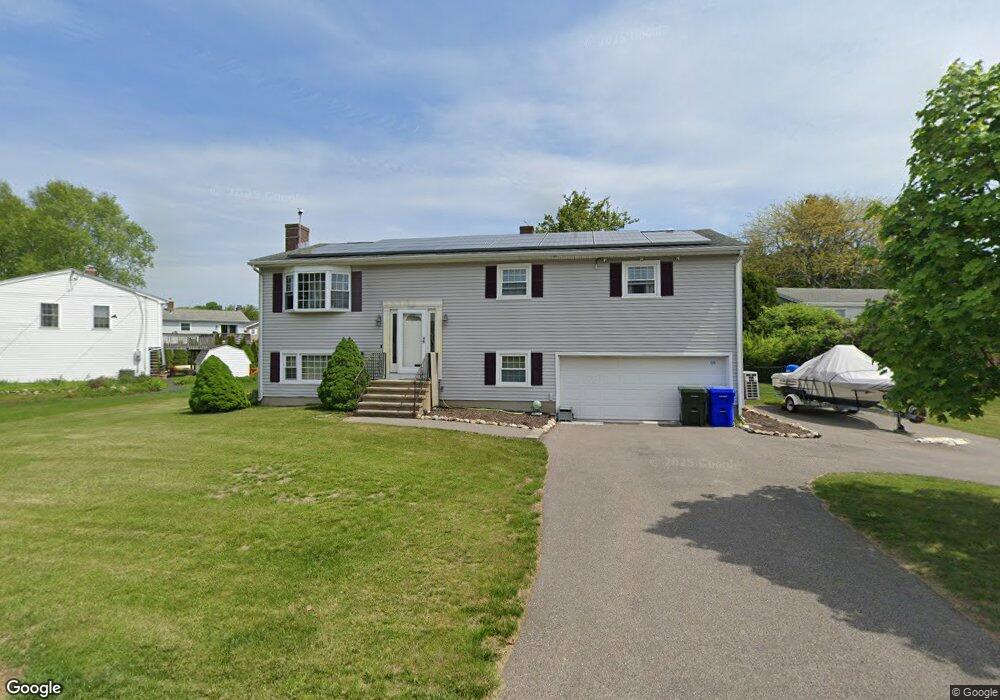
216 Seneca Dr Groton, CT 06340
Noank NeighborhoodEstimated Value: $564,794 - $634,000
4
Beds
2
Baths
2,020
Sq Ft
$299/Sq Ft
Est. Value
About This Home
This home is located at 216 Seneca Dr, Groton, CT 06340 and is currently estimated at $603,199, approximately $298 per square foot. 216 Seneca Dr is a home located in New London County with nearby schools including Groton Middle School and Robert E. Fitch High School.
Ownership History
Date
Name
Owned For
Owner Type
Purchase Details
Closed on
Apr 5, 2017
Sold by
Scott 3Rd Kenneth E
Bought by
Scott 3Rd Kenneth E and Scott Linda J
Current Estimated Value
Purchase Details
Closed on
Oct 13, 2016
Sold by
Scott Linda J
Bought by
Scott Kenneth E
Home Financials for this Owner
Home Financials are based on the most recent Mortgage that was taken out on this home.
Original Mortgage
$224,000
Interest Rate
3.46%
Mortgage Type
New Conventional
Purchase Details
Closed on
May 13, 2014
Sold by
Scott 3Rd Kenneth E
Bought by
Scott 3Rd Kenneth E and Scott Linda J
Purchase Details
Closed on
Sep 5, 2013
Sold by
Peterson Fern E and Peterson Howard A
Bought by
Scott 3Rd Kenneth E
Home Financials for this Owner
Home Financials are based on the most recent Mortgage that was taken out on this home.
Original Mortgage
$128,200
Interest Rate
4.34%
Create a Home Valuation Report for This Property
The Home Valuation Report is an in-depth analysis detailing your home's value as well as a comparison with similar homes in the area
Home Values in the Area
Average Home Value in this Area
Purchase History
| Date | Buyer | Sale Price | Title Company |
|---|---|---|---|
| Scott 3Rd Kenneth E | -- | -- | |
| Scott Kenneth E | -- | -- | |
| Scott 3Rd Kenneth E | -- | -- | |
| Scott 3Rd Kenneth E | -- | -- |
Source: Public Records
Mortgage History
| Date | Status | Borrower | Loan Amount |
|---|---|---|---|
| Previous Owner | Scott Kenneth E | $224,000 | |
| Previous Owner | Scott 3Rd Kenneth E | $128,200 |
Source: Public Records
Tax History
| Year | Tax Paid | Tax Assessment Tax Assessment Total Assessment is a certain percentage of the fair market value that is determined by local assessors to be the total taxable value of land and additions on the property. | Land | Improvement |
|---|---|---|---|---|
| 2025 | $7,146 | $270,900 | $139,580 | $131,320 |
| 2024 | $6,672 | $270,900 | $139,580 | $131,320 |
| 2023 | $6,396 | $270,900 | $83,300 | $187,600 |
| 2022 | $6,266 | $270,900 | $83,300 | $187,600 |
| 2021 | $5,150 | $186,200 | $61,740 | $124,460 |
| 2020 | $5,018 | $186,200 | $61,740 | $124,460 |
| 2019 | $4,791 | $186,200 | $61,740 | $124,460 |
| 2018 | $4,759 | $186,200 | $61,740 | $124,460 |
| 2017 | $4,677 | $186,200 | $61,740 | $124,460 |
| 2016 | $4,740 | $204,120 | $90,860 | $113,260 |
Source: Public Records
Map
Nearby Homes
Your Personal Tour Guide
Ask me questions while you tour the home.