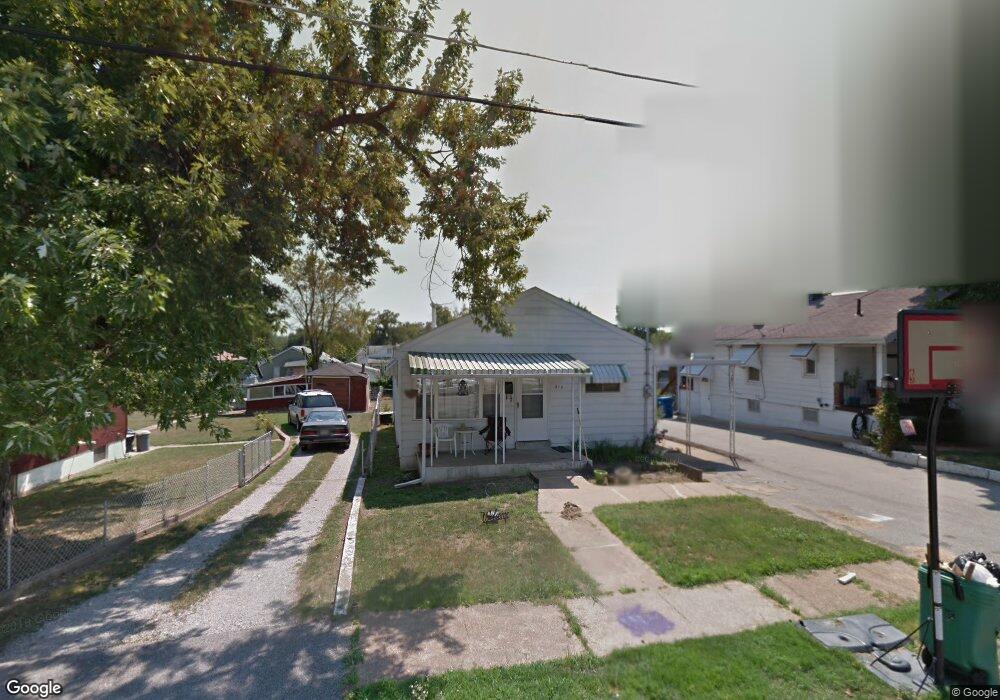
216 W Holden Ave Saint Louis, MO 63125
Lemay NeighborhoodEstimated Value: $126,786 - $164,000
3
Beds
1
Bath
960
Sq Ft
$150/Sq Ft
Est. Value
About This Home
This home is located at 216 W Holden Ave, Saint Louis, MO 63125 and is currently estimated at $144,447, approximately $150 per square foot. 216 W Holden Ave is a home located in St. Louis County with nearby schools including Hancock Place Elementary School, Hancock Place Middle School, and Hancock Place High School.
Ownership History
Date
Name
Owned For
Owner Type
Purchase Details
Closed on
Dec 6, 2022
Sold by
Stephens Eric V and Stephens Cinthia L
Bought by
Eric Vaine Stephens and Eric Cinthia Lynette
Current Estimated Value
Purchase Details
Closed on
May 20, 2014
Sold by
Stephens Eric and Stephens Cinthia L
Bought by
Stephens Eric and Stephens Cinthia L
Purchase Details
Closed on
Oct 18, 2012
Sold by
Secretary Of Housing & Urban Development
Bought by
Stephens Eric
Purchase Details
Closed on
Jan 12, 2012
Sold by
Pnc Bank National Association
Bought by
Secretary Of Housing & Urban Development
Purchase Details
Closed on
Dec 7, 2011
Sold by
Wadlow Christina N
Bought by
Pnc Bank National Association
Purchase Details
Closed on
Jun 2, 2009
Sold by
Hamlyn Richard A and Hamlyn Helen
Bought by
Wadlow Christina N
Home Financials for this Owner
Home Financials are based on the most recent Mortgage that was taken out on this home.
Original Mortgage
$3,000
Interest Rate
4.72%
Mortgage Type
Future Advance Clause Open End Mortgage
Create a Home Valuation Report for This Property
The Home Valuation Report is an in-depth analysis detailing your home's value as well as a comparison with similar homes in the area
Home Values in the Area
Average Home Value in this Area
Purchase History
| Date | Buyer | Sale Price | Title Company |
|---|---|---|---|
| Eric Vaine Stephens | -- | -- | |
| Stephens Eric | -- | None Available | |
| Stephens Eric | $32,000 | None Available | |
| Secretary Of Housing & Urban Development | $93,438 | None Available | |
| Pnc Bank National Association | $93,438 | None Available | |
| Wadlow Christina N | -- | None Available |
Source: Public Records
Mortgage History
| Date | Status | Borrower | Loan Amount |
|---|---|---|---|
| Previous Owner | Wadlow Christina N | $3,000 | |
| Previous Owner | Wadlow Christina N | $81,005 |
Source: Public Records
Tax History Compared to Growth
Tax History
| Year | Tax Paid | Tax Assessment Tax Assessment Total Assessment is a certain percentage of the fair market value that is determined by local assessors to be the total taxable value of land and additions on the property. | Land | Improvement |
|---|---|---|---|---|
| 2025 | $1,908 | $24,210 | $7,450 | $16,760 |
| 2024 | $1,908 | $24,570 | $5,590 | $18,980 |
| 2023 | $1,812 | $24,570 | $5,590 | $18,980 |
| 2022 | $1,683 | $20,660 | $4,850 | $15,810 |
| 2021 | $1,653 | $20,660 | $4,850 | $15,810 |
| 2020 | $1,205 | $15,960 | $5,590 | $10,370 |
| 2019 | $1,339 | $15,960 | $5,590 | $10,370 |
| 2018 | $1,261 | $13,100 | $4,280 | $8,820 |
| 2017 | $1,239 | $13,100 | $4,280 | $8,820 |
| 2016 | $1,153 | $11,720 | $2,980 | $8,740 |
| 2015 | $1,156 | $11,720 | $2,980 | $8,740 |
| 2014 | $984 | $10,560 | $3,400 | $7,160 |
Source: Public Records
Map
Nearby Homes
- 156 W Holden Ave
- 9723 Gentry Ave
- 210 W Felton Ave
- 147 W Velma Ave
- 149 W Felton Ave
- 320 Degenhardt Ave
- 311 Degenhardt Ave
- 1408 Dammert Ave
- 331 Rauhut Ave
- 9704 S Broadway
- 115 W Cartwright Ave
- 113 E Velma Ave
- 122 E Etta Ave
- 135 E Holden Ave
- 125 E Etta Ave
- 308 Carthage Ave
- 724 Bartolet Ave
- 135 E Loretta Ave
- 114 Mann St
- 140 E Loretta Ave
- 218 W Holden Ave
- 214 W Holden Ave
- 220 W Holden Ave
- 212 W Holden Ave
- 9535 Longwood Ave
- 210 W Holden Ave
- 215 W Loretta Ave
- 217 W Loretta Ave
- 222 W Holden Ave
- 219 W Loretta Ave
- 213 W Loretta Ave
- 9533 Longwood Ave
- 208 W Holden Ave
- 211 W Loretta Ave
- 221 W Loretta Ave
- 209 W Holden Ave
- 224 W Holden Ave
- 9529 Longwood Ave
- 209 W Loretta Ave
- 223 W Loretta Ave