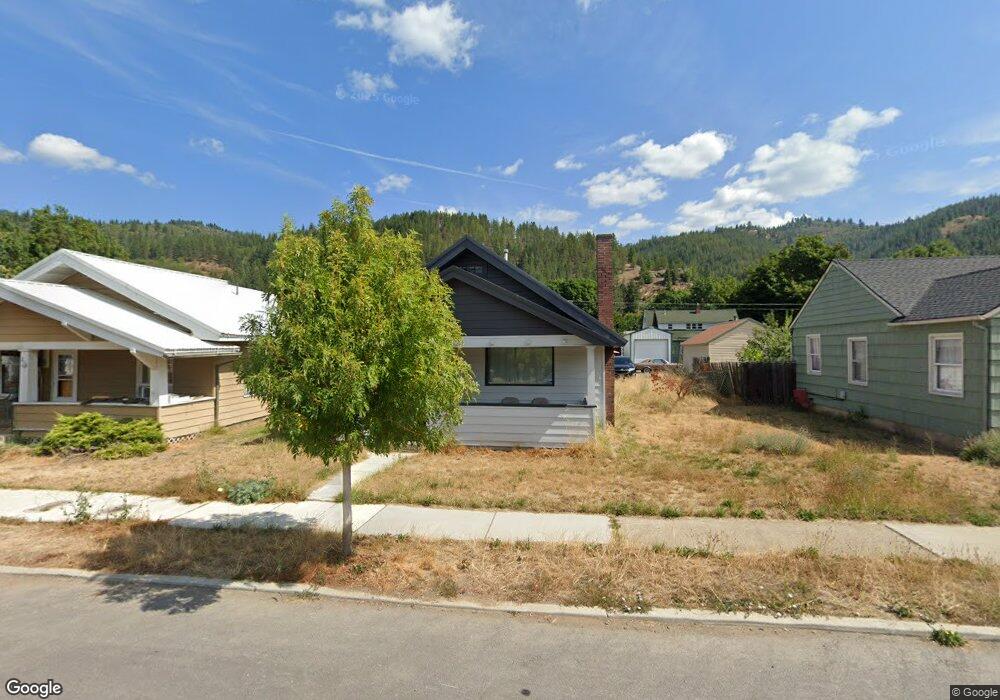
216 W Mullan Ave Kellogg, ID 83837
Estimated Value: $259,000 - $362,000
2
Beds
1
Bath
1,215
Sq Ft
$240/Sq Ft
Est. Value
About This Home
This home is located at 216 W Mullan Ave, Kellogg, ID 83837 and is currently estimated at $291,500, approximately $239 per square foot. 216 W Mullan Ave is a home located in Shoshone County with nearby schools including Pinehurst Elementary School, Kellogg Middle School, and Kellogg High School.
Ownership History
Date
Name
Owned For
Owner Type
Purchase Details
Closed on
Mar 26, 2025
Sold by
Howard Phillip M and Howard Carolann R
Bought by
Leavitt Benjamin
Current Estimated Value
Home Financials for this Owner
Home Financials are based on the most recent Mortgage that was taken out on this home.
Original Mortgage
$268,000
Outstanding Balance
$266,860
Interest Rate
6.87%
Mortgage Type
New Conventional
Estimated Equity
$24,640
Purchase Details
Closed on
Dec 12, 2023
Sold by
Cooper Clarisse A and Cooper William J
Bought by
Howard Phillip M and Howard Carolann R
Purchase Details
Closed on
May 4, 2023
Sold by
Cooper Clarisse A and Cooper William J
Bought by
Cooper Clarisse A and Cooper William J
Purchase Details
Closed on
Jul 24, 2006
Sold by
Lindberg Cooper Clarisse A and Lindberg Clarisse A
Bought by
Lindberg Cooper Clarisse A and Cooper William J
Home Financials for this Owner
Home Financials are based on the most recent Mortgage that was taken out on this home.
Original Mortgage
$63,000
Interest Rate
6.69%
Create a Home Valuation Report for This Property
The Home Valuation Report is an in-depth analysis detailing your home's value as well as a comparison with similar homes in the area
Home Values in the Area
Average Home Value in this Area
Purchase History
| Date | Buyer | Sale Price | Title Company |
|---|---|---|---|
| Leavitt Benjamin | -- | Alliance Title | |
| Howard Phillip M | -- | Flying S Title And Escrow | |
| Cooper Clarisse A | -- | None Listed On Document | |
| Lindberg Cooper Clarisse A | -- | -- |
Source: Public Records
Mortgage History
| Date | Status | Borrower | Loan Amount |
|---|---|---|---|
| Open | Leavitt Benjamin | $268,000 | |
| Previous Owner | Lindberg Cooper Clarisse A | $63,000 |
Source: Public Records
Tax History Compared to Growth
Tax History
| Year | Tax Paid | Tax Assessment Tax Assessment Total Assessment is a certain percentage of the fair market value that is determined by local assessors to be the total taxable value of land and additions on the property. | Land | Improvement |
|---|---|---|---|---|
| 2025 | -- | $270,884 | $86,180 | $184,704 |
| 2024 | $2,805 | $270,884 | $86,180 | $184,704 |
| 2023 | $2,805 | $234,907 | $78,843 | $156,064 |
| 2022 | $2,655 | $202,983 | $72,721 | $130,262 |
| 2021 | $2,673 | $145,357 | $26,937 | $118,420 |
| 2020 | $2,245 | $118,448 | $24,997 | $93,451 |
| 2019 | $2,276 | $110,116 | $20,025 | $90,091 |
| 2018 | $1,714 | $70,517 | $18,205 | $52,312 |
| 2017 | $1,586 | $66,285 | $18,205 | $48,080 |
| 2016 | $1,537 | $62,195 | $18,205 | $43,990 |
| 2015 | $1,505 | $61,695 | $18,205 | $43,490 |
| 2014 | $1,516 | $61,754 | $18,204 | $43,550 |
Source: Public Records
Map
Nearby Homes
- 130 W Mullan Ave
- 138 W Riverside Ave
- NKA Riverside Ave W
- 316 W Mission Ave
- 404 Mullan Ave W
- 411 W Mullan Ave
- 0 Vergobbi Unit 25-4752
- 316 W Brown Ave
- 414 W Mission Ave
- 110 Morning Star Dr Unit 159
- 110 Morning Star Dr Unit 332
- 150 Morning Star Dr Unit 371
- 150 Morning Star Dr Unit 379
- 150 Morning Star Dr Unit 381
- 150 Morning Star Dr Unit 292
- 516 W Mullan Ave
- 516 W Mission Ave
- 520 W Mission Ave
- 512 W Cameron Ave
- 140 Railroad Ave Units 1-5
- 218 W Mullan Ave
- 214 W Mullan Ave
- 220 W Mullan Ave
- 211 W Mission Ave
- 222 W Mullan Ave
- 213 W Mission Ave
- 209 W Mission Ave
- 205 W Mission Ave
- 202 W Mullan Ave
- 215 W Mullan Ave
- 215 W Mission Ave
- 219 Mullan Ave W
- 224 W Mullan Ave
- 211 W Mullan Ave
- 217 W Mission Ave
- 221 W Mullan Ave
- 223 W Mullan Ave
- 203 W Mission Ave
- 200 W Mullan Ave
- 219 W Mission Ave