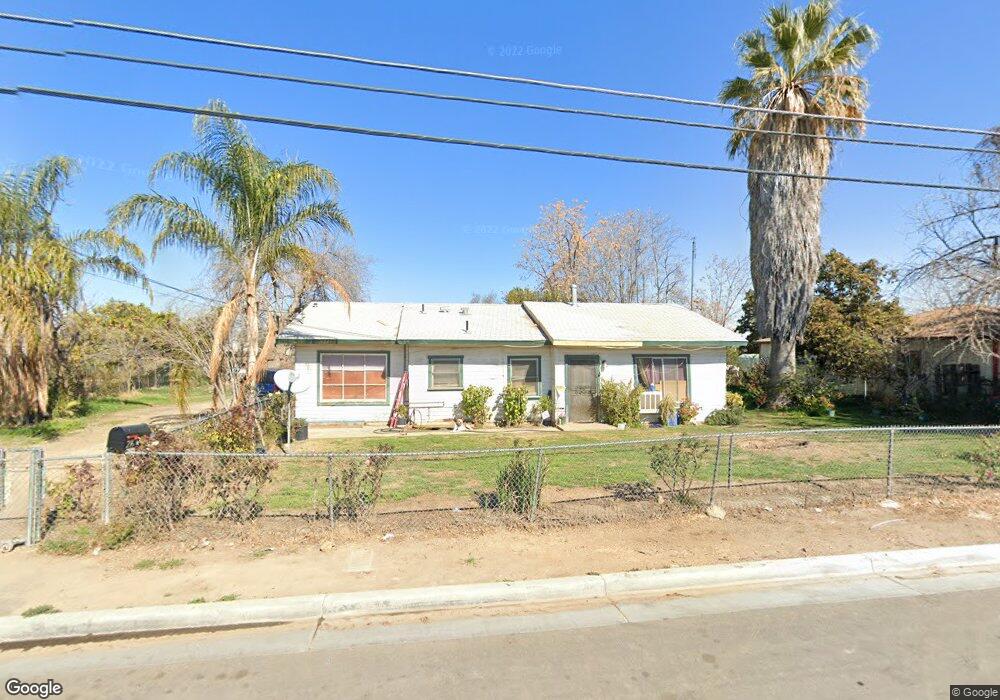
216 W Tulare Ave Shafter, CA 93263
Estimated Value: $209,000 - $269,623
3
Beds
1
Bath
922
Sq Ft
$274/Sq Ft
Est. Value
About This Home
This home is located at 216 W Tulare Ave, Shafter, CA 93263 and is currently estimated at $252,656, approximately $274 per square foot. 216 W Tulare Ave is a home located in Kern County with nearby schools including Redwood Elementary School, Golden Oak Elementary School, and Shafter High School.
Ownership History
Date
Name
Owned For
Owner Type
Purchase Details
Closed on
Dec 13, 2002
Sold by
Mancilla Jose
Bought by
Martinez Arturo
Current Estimated Value
Purchase Details
Closed on
Sep 18, 1995
Sold by
Espericueta Leroy and Espericueta Maria Francisca
Bought by
Martinez Arturo and Mancilla Jose
Home Financials for this Owner
Home Financials are based on the most recent Mortgage that was taken out on this home.
Original Mortgage
$67,651
Interest Rate
7.59%
Mortgage Type
FHA
Purchase Details
Closed on
May 5, 1995
Sold by
Espericueta Leroy and Espericueta Maria Francisca
Bought by
Espericueta Leroy and Espericueta Maria Francisca
Home Financials for this Owner
Home Financials are based on the most recent Mortgage that was taken out on this home.
Original Mortgage
$42,000
Interest Rate
8.51%
Purchase Details
Closed on
Apr 18, 1994
Sold by
Espericueta Leroy and Espericueta Maria Francisca
Bought by
Espericueta Leroy and Espericueta Maria Francisca
Create a Home Valuation Report for This Property
The Home Valuation Report is an in-depth analysis detailing your home's value as well as a comparison with similar homes in the area
Home Values in the Area
Average Home Value in this Area
Purchase History
| Date | Buyer | Sale Price | Title Company |
|---|---|---|---|
| Martinez Arturo | -- | -- | |
| Martinez Arturo | $67,500 | Fidelity National Title | |
| Espericueta Leroy | -- | Heritage Title Company | |
| Espericueta Leroy | -- | -- |
Source: Public Records
Mortgage History
| Date | Status | Borrower | Loan Amount |
|---|---|---|---|
| Previous Owner | Martinez Arturo | $67,651 | |
| Previous Owner | Espericueta Leroy | $42,000 |
Source: Public Records
Tax History Compared to Growth
Tax History
| Year | Tax Paid | Tax Assessment Tax Assessment Total Assessment is a certain percentage of the fair market value that is determined by local assessors to be the total taxable value of land and additions on the property. | Land | Improvement |
|---|---|---|---|---|
| 2025 | $1,777 | $112,096 | $33,206 | $78,890 |
| 2024 | $1,727 | $109,899 | $32,555 | $77,344 |
| 2023 | $1,727 | $107,745 | $31,917 | $75,828 |
| 2022 | $1,627 | $105,634 | $31,292 | $74,342 |
| 2021 | $1,563 | $103,564 | $30,679 | $72,885 |
| 2020 | $1,507 | $102,503 | $30,365 | $72,138 |
| 2019 | $1,501 | $102,503 | $30,365 | $72,138 |
| 2018 | $1,451 | $98,525 | $29,187 | $69,338 |
| 2017 | $1,440 | $96,594 | $28,615 | $67,979 |
| 2016 | $1,376 | $94,701 | $28,054 | $66,647 |
| 2015 | $1,327 | $93,279 | $27,633 | $65,646 |
| 2014 | $1,066 | $72,000 | $18,000 | $54,000 |
Source: Public Records
Map
Nearby Homes
- 681 California 43
- 419 Santa Maria Way
- 436 N Reiker St
- 401 Klassen St
- 509 Prince Ln
- 188 N Wall St
- 617 Sammy Way
- 200 Justin Ct
- 553 Grundy Ave
- 208 California Ave
- 732 Sammy Way
- 155 Redwood Dr
- 209 Pacific Ave
- 30142 W Tulare Ave
- 1008 Eckmann St
- 517 Sycamore Ave
- 0 Acacia Ave
- 915 Tomboy Ct
- 269 Burns Ct
- 914 Tomboy Ct