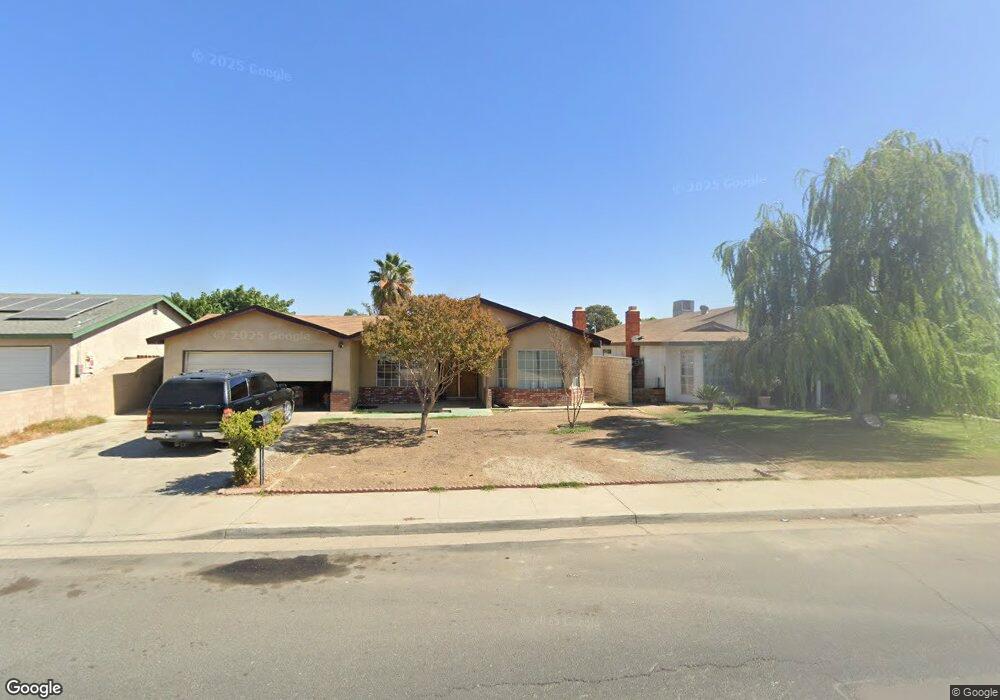
2160 Quincy St Delano, CA 93215
East Delano NeighborhoodEstimated Value: $222,000 - $286,265
3
Beds
2
Baths
1,304
Sq Ft
$195/Sq Ft
Est. Value
About This Home
This home is located at 2160 Quincy St, Delano, CA 93215 and is currently estimated at $254,816, approximately $195 per square foot. 2160 Quincy St is a home located in Kern County with nearby schools including Princeton Street Elementary School, Delano High School, and Cecil Avenue Math & Science Academy.
Ownership History
Date
Name
Owned For
Owner Type
Purchase Details
Closed on
Sep 27, 2011
Sold by
U S Bank National Association
Bought by
Munoz Adan V and Munoz Juana P
Current Estimated Value
Purchase Details
Closed on
Jun 10, 2011
Sold by
Domondon Jorge
Bought by
U S Bank National Association
Purchase Details
Closed on
Sep 19, 2005
Sold by
Domondon Jolly
Bought by
Domondon Jorge
Home Financials for this Owner
Home Financials are based on the most recent Mortgage that was taken out on this home.
Original Mortgage
$36,000
Interest Rate
5.72%
Mortgage Type
Stand Alone Second
Purchase Details
Closed on
Sep 7, 2005
Sold by
Yu How Kwong and Yu Sally S L
Bought by
Domondon Jorge
Home Financials for this Owner
Home Financials are based on the most recent Mortgage that was taken out on this home.
Original Mortgage
$36,000
Interest Rate
5.72%
Mortgage Type
Stand Alone Second
Create a Home Valuation Report for This Property
The Home Valuation Report is an in-depth analysis detailing your home's value as well as a comparison with similar homes in the area
Home Values in the Area
Average Home Value in this Area
Purchase History
We collect this data history from publicly available records. To have your information removed, we recommend requesting removal directly through your county’s website.
| Date | Buyer | Sale Price | Title Company |
|---|---|---|---|
| Munoz Adan V | $85,000 | Ticor Title Company Of Ca | |
| U S Bank National Association | $97,055 | Accommodation | |
| Domondon Jorge | -- | First American Title | |
| Domondon Jorge | $180,000 | First American Title |
Source: Public Records
Mortgage History
We collect this data history from publicly available records. To have your information removed, we recommend requesting removal directly through your county’s website.
| Date | Status | Borrower | Loan Amount |
|---|---|---|---|
| Previous Owner | Domondon Jorge | $36,000 | |
| Previous Owner | Domondon Jorge | $144,000 |
Source: Public Records
Tax History
| Year | Tax Paid | Tax Assessment Tax Assessment Total Assessment is a certain percentage of the fair market value that is determined by local assessors to be the total taxable value of land and additions on the property. | Land | Improvement |
|---|---|---|---|---|
| 2025 | $1,347 | $106,751 | $25,114 | $81,637 |
| 2024 | $1,307 | $104,659 | $24,622 | $80,037 |
| 2023 | $1,307 | $102,608 | $24,140 | $78,468 |
| 2022 | $1,283 | $100,597 | $23,667 | $76,930 |
| 2021 | $1,217 | $98,625 | $23,203 | $75,422 |
| 2020 | $1,209 | $97,615 | $22,966 | $74,649 |
| 2019 | $1,188 | $97,615 | $22,966 | $74,649 |
| 2018 | $1,173 | $93,826 | $22,075 | $71,751 |
| 2017 | $1,181 | $91,988 | $21,643 | $70,345 |
| 2016 | $1,162 | $90,185 | $21,219 | $68,966 |
| 2015 | $1,201 | $88,832 | $20,901 | $67,931 |
| 2014 | $1,122 | $87,093 | $20,492 | $66,601 |
Source: Public Records
Map
Nearby Homes
- 2168 Quincy St
- 2014 Rounds St
- 1835 Blossom Ave
- 2334 Rounds St
- 1473 22nd Ave
- 2242 Oleander St
- 1611 16th Place
- 0 Cecil Ave
- 2209 Ruffino Ct
- 2042 Girard St Unit 126
- 2042 Girard St Unit 130
- 2042 Girard St Unit 68
- 1734 Main St
- 2015 Romolo St
- 1519 12th Ave
- 2111 Girard St
- 0 County Line Unit 24691385
- 0 County Line Unit 24045237
- 0 County Line Unit 202402975
- 0 County Line Unit 202507492
Your Personal Tour Guide
Ask me questions while you tour the home.