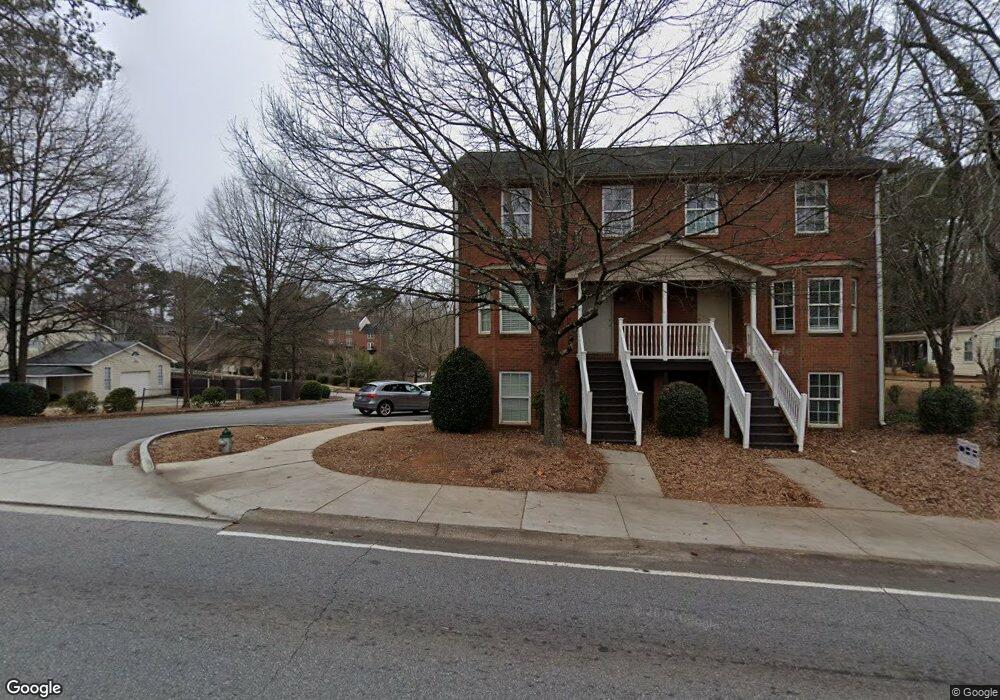
2160 S Milledge Ave Athens, GA 30605
Estimated Value: $242,000 - $6,897,547
--
Bed
2
Baths
1,232
Sq Ft
$2,898/Sq Ft
Est. Value
About This Home
This home is located at 2160 S Milledge Ave, Athens, GA 30605 and is currently estimated at $3,569,774, approximately $2,897 per square foot. 2160 S Milledge Ave is a home located in Clarke County with nearby schools including Barrow Elementary School, Clarke Middle School, and Clarke Central High School.
Ownership History
Date
Name
Owned For
Owner Type
Purchase Details
Closed on
Jun 19, 2012
Sold by
Pineview Drive Properties
Bought by
Properti South Hampton Terrace
Current Estimated Value
Purchase Details
Closed on
Jun 13, 2005
Sold by
Gay Jimmy A
Bought by
Pineview Drive Properties Llc
Home Financials for this Owner
Home Financials are based on the most recent Mortgage that was taken out on this home.
Original Mortgage
$2,800,000
Interest Rate
5.7%
Mortgage Type
New Conventional
Purchase Details
Closed on
Mar 19, 2003
Sold by
Fain John W
Bought by
Gay Jimmy A
Purchase Details
Closed on
May 6, 2002
Sold by
Culp Annie Ruth Dixon Estate Of
Bought by
Fain John W
Purchase Details
Closed on
Feb 11, 2002
Sold by
Culp Henry T By Exec
Bought by
Culp Annie R By Adm
Create a Home Valuation Report for This Property
The Home Valuation Report is an in-depth analysis detailing your home's value as well as a comparison with similar homes in the area
Home Values in the Area
Average Home Value in this Area
Purchase History
| Date | Buyer | Sale Price | Title Company |
|---|---|---|---|
| Properti South Hampton Terrace | -- | -- | |
| Pineview Drive Properties Llc | -- | -- | |
| Gay Jimmy A | -- | -- | |
| Fain John W | $181,500 | -- | |
| Culp Annie R By Adm | -- | -- |
Source: Public Records
Mortgage History
| Date | Status | Borrower | Loan Amount |
|---|---|---|---|
| Previous Owner | Pineview Drive Properties Llc | $2,800,000 |
Source: Public Records
Tax History Compared to Growth
Tax History
| Year | Tax Paid | Tax Assessment Tax Assessment Total Assessment is a certain percentage of the fair market value that is determined by local assessors to be the total taxable value of land and additions on the property. | Land | Improvement |
|---|---|---|---|---|
| 2024 | $73,033 | $1,983,578 | $110,720 | $1,872,858 |
| 2023 | $68,924 | $1,854,859 | $110,720 | $1,744,139 |
| 2022 | $53,045 | $1,662,845 | $83,040 | $1,579,805 |
| 2021 | $46,950 | $1,393,168 | $83,040 | $1,310,128 |
| 2020 | $41,951 | $1,244,851 | $83,040 | $1,161,811 |
| 2019 | $40,633 | $1,196,854 | $83,040 | $1,113,814 |
| 2018 | $36,645 | $1,079,403 | $83,040 | $996,363 |
| 2017 | $34,260 | $1,009,130 | $83,040 | $926,090 |
| 2016 | $34,176 | $1,006,659 | $83,040 | $923,619 |
| 2015 | $33,915 | $997,508 | $83,040 | $914,468 |
| 2014 | $32,308 | $948,848 | $83,040 | $865,808 |
Source: Public Records
Map
Nearby Homes
- 260 Weymanda Cir
- 2165 S Milledge Ave Unit F4
- 123 Garden Ln
- 595 Macon Hwy
- 595 Macon Hwy Unit 9
- 595 Macon Hwy Unit 39
- 145 Heatherwood Ln
- 100 Woodstone Dr Unit 12
- 100 Woodstone Dr Unit 10
- 205 Woodstone Dr
- 205 Woodstone Dr Unit 14
- 275 Davis Estates Rd
- 185 Eaglewood Way
- 156 Fernbanks Ct
- 780 Macon Hwy
- 143 Eaglewood Way Unit 17
- 201 Hamilton Rd Unit 7
- 105 Southhampton Pointe
- 230 Weymanda Cir
- 240 Weymanda Cir
- 2170 S Milledge Ave
- 2150 S Milledge Ave
- 220 Weymanda Cir
- 250 Weymanda Cir
- 125 Weymanda Ct
- 125 Weymanda Cir
- 2168 S Milledge Ave Unit F6
- 150 Pineview Dr
- 145 Pineview Dr
- 155 Pineview Dr
- 115 Southhampton Pointe
- 129 Weymanda Ct
- 135 Pineview Dr
- 2163 S Milledge Ave
- 165 Pineview Dr
- 110 Southhampton Pointe
- 2161 S Milledge Ave