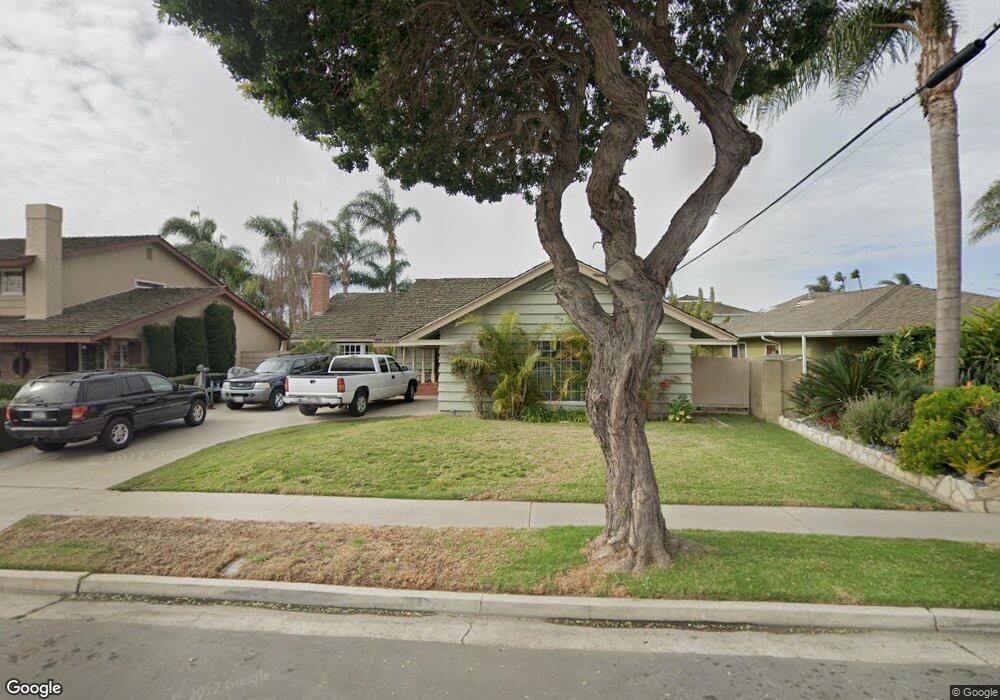
21601 Kaneohe Ln Huntington Beach, CA 92646
Southeast NeighborhoodEstimated Value: $1,404,672 - $1,780,000
4
Beds
2
Baths
1,656
Sq Ft
$969/Sq Ft
Est. Value
About This Home
This home is located at 21601 Kaneohe Ln, Huntington Beach, CA 92646 and is currently estimated at $1,605,418, approximately $969 per square foot. 21601 Kaneohe Ln is a home located in Orange County with nearby schools including John H. Eader Elementary School, Isaac L. Sowers Middle School, and Edison High School.
Ownership History
Date
Name
Owned For
Owner Type
Purchase Details
Closed on
Jul 13, 2021
Sold by
Mcnerney Patricia Harriet
Bought by
Whitfield Christine
Current Estimated Value
Purchase Details
Closed on
Jun 15, 2021
Sold by
Whitfield Christine and The Bypass Trust
Bought by
Mcnerney Lawrence
Purchase Details
Closed on
Oct 27, 2016
Sold by
Mcnerney Conway Family Revocable Trust
Bought by
Mcnerney Patricia Harriet Conway and The Bypass Trust Under The Mcnerney Conw
Purchase Details
Closed on
Oct 1, 1999
Sold by
Mcnerney James L and Mcnerney Patricia H
Bought by
Mcnerney James L and Mcnerney Patricia H
Purchase Details
Closed on
Nov 19, 1998
Sold by
Morgan Howard H
Bought by
Mcnerney James L and Mcnerney Patricia H
Home Financials for this Owner
Home Financials are based on the most recent Mortgage that was taken out on this home.
Original Mortgage
$123,000
Interest Rate
6.91%
Create a Home Valuation Report for This Property
The Home Valuation Report is an in-depth analysis detailing your home's value as well as a comparison with similar homes in the area
Home Values in the Area
Average Home Value in this Area
Purchase History
| Date | Buyer | Sale Price | Title Company |
|---|---|---|---|
| Whitfield Christine | -- | -- | |
| Mcnerney Lawrence | -- | None Available | |
| Mcnerney Patricia Harriet Conway | -- | None Available | |
| Mcnerney James L | -- | -- | |
| Mcnerney James L | $312,000 | Orange Coast Title |
Source: Public Records
Mortgage History
| Date | Status | Borrower | Loan Amount |
|---|---|---|---|
| Previous Owner | Mcnerney James L | $123,000 |
Source: Public Records
Tax History Compared to Growth
Tax History
| Year | Tax Paid | Tax Assessment Tax Assessment Total Assessment is a certain percentage of the fair market value that is determined by local assessors to be the total taxable value of land and additions on the property. | Land | Improvement |
|---|---|---|---|---|
| 2025 | $5,602 | $489,119 | $375,298 | $113,821 |
| 2024 | $5,602 | $479,529 | $367,939 | $111,590 |
| 2023 | $5,474 | $470,127 | $360,725 | $109,402 |
| 2022 | $5,328 | $460,909 | $353,652 | $107,257 |
| 2021 | $5,306 | $451,872 | $346,718 | $105,154 |
| 2020 | $5,271 | $447,239 | $343,163 | $104,076 |
| 2019 | $5,210 | $438,470 | $336,434 | $102,036 |
| 2018 | $5,130 | $429,873 | $329,837 | $100,036 |
| 2017 | $5,062 | $421,445 | $323,370 | $98,075 |
| 2016 | $4,842 | $413,182 | $317,030 | $96,152 |
| 2015 | $4,795 | $406,976 | $312,268 | $94,708 |
| 2014 | $4,695 | $399,004 | $306,151 | $92,853 |
Source: Public Records
Map
Nearby Homes
- 21621 Kaneohe Ln
- 9171 Regatta Dr
- 9021 Niguel Cir
- 9101 Aloha Dr
- 21722 Hilaria Cir
- 9411 Daytona Cir
- 9112 Playa Dr
- 9562 Rockpoint Dr
- 22042 Surfrider Ln
- 21221 Hillsdale Ln
- 21292 Bulkhead Cir
- 21941 Oceanview Ln
- 21211 Poston Ln
- 21361 Lemontree Ln
- 21382 Lemontree Ln
- 21861 Vacation Ln
- 9695 Brookbay Cir
- 22102 Wood Island Ln
- 9221 Belcaro Dr
- 9802 Effingham Dr
- 21611 Kaneohe Ln
- 21591 Kaneohe Ln
- 21602 Bahama Ln
- 21612 Bahama Ln
- 21592 Bahama Ln
- 21622 Bahama Ln
- 21602 Kaneohe Ln
- 21612 Kaneohe Ln
- 21592 Kaneohe Ln
- 21631 Kaneohe Ln
- 21622 Kaneohe Ln
- 21582 Kaneohe Ln
- 21632 Bahama Ln
- 9181 Haiti Dr
- 9171 Haiti Dr
- 21632 Kaneohe Ln
- 21572 Kaneohe Ln
- 9161 Haiti Dr
- 21641 Kaneohe Ln
- 21601 Bahama Ln