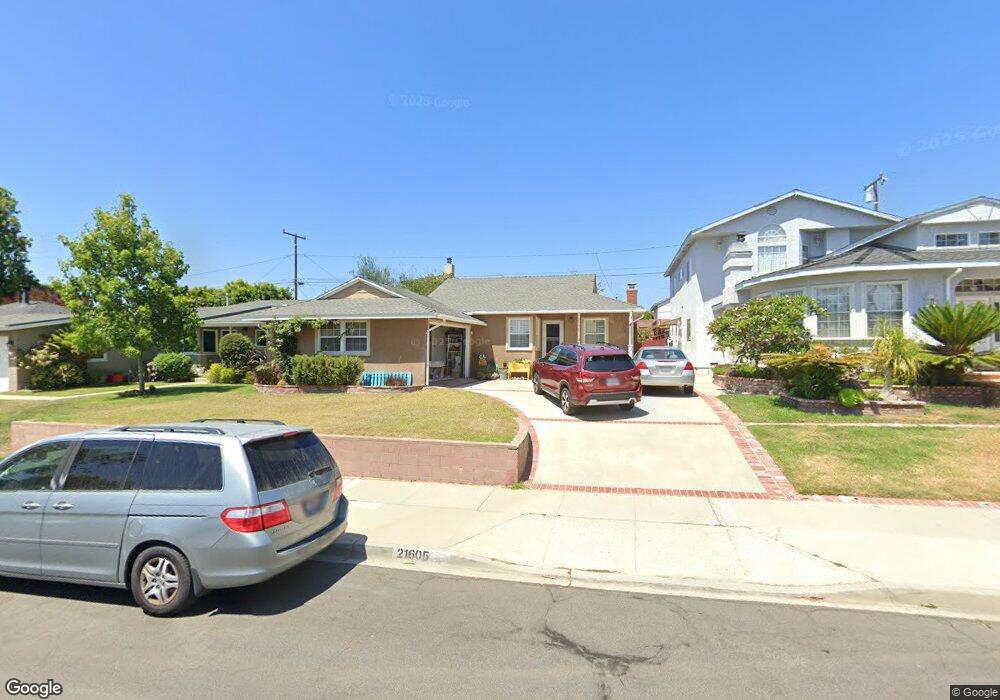
21605 Evalyn Ave Torrance, CA 90503
Southwood NeighborhoodEstimated Value: $1,383,072 - $1,500,000
3
Beds
2
Baths
1,725
Sq Ft
$849/Sq Ft
Est. Value
About This Home
This home is located at 21605 Evalyn Ave, Torrance, CA 90503 and is currently estimated at $1,465,268, approximately $849 per square foot. 21605 Evalyn Ave is a home located in Los Angeles County with nearby schools including Anza Elementary School, Jefferson Middle School, and West High School.
Ownership History
Date
Name
Owned For
Owner Type
Purchase Details
Closed on
May 11, 2015
Sold by
Giampaoli Robert E
Bought by
The Giampaoli Family Trust
Current Estimated Value
Purchase Details
Closed on
Jul 8, 2002
Sold by
Giampaoli Robert E
Bought by
Giampaoli Robert E and Giampaoli Alesia L
Home Financials for this Owner
Home Financials are based on the most recent Mortgage that was taken out on this home.
Original Mortgage
$267,000
Outstanding Balance
$113,187
Interest Rate
6.71%
Estimated Equity
$1,352,081
Purchase Details
Closed on
Jun 25, 2001
Sold by
Giampaoli Robert E
Bought by
Giampaoli Robert E and Giampaoli Alesia L
Purchase Details
Closed on
Jan 23, 1998
Sold by
Dickinson Jack V
Bought by
Giampaoli Robert E and Giampaoli Alesia L
Home Financials for this Owner
Home Financials are based on the most recent Mortgage that was taken out on this home.
Original Mortgage
$279,200
Interest Rate
6.98%
Create a Home Valuation Report for This Property
The Home Valuation Report is an in-depth analysis detailing your home's value as well as a comparison with similar homes in the area
Home Values in the Area
Average Home Value in this Area
Purchase History
| Date | Buyer | Sale Price | Title Company |
|---|---|---|---|
| The Giampaoli Family Trust | -- | None Available | |
| Giampaoli Robert E | -- | Chicago Title Co | |
| Giampaoli Robert E | -- | -- | |
| Giampaoli Robert E | $349,000 | Fidelity National Title Ins |
Source: Public Records
Mortgage History
| Date | Status | Borrower | Loan Amount |
|---|---|---|---|
| Open | Giampaoli Robert E | $267,000 | |
| Closed | Giampaoli Robert E | $279,200 |
Source: Public Records
Tax History Compared to Growth
Tax History
| Year | Tax Paid | Tax Assessment Tax Assessment Total Assessment is a certain percentage of the fair market value that is determined by local assessors to be the total taxable value of land and additions on the property. | Land | Improvement |
|---|---|---|---|---|
| 2025 | $6,316 | $546,578 | $404,770 | $141,808 |
| 2024 | $6,316 | $535,862 | $396,834 | $139,028 |
| 2023 | $6,201 | $525,355 | $389,053 | $136,302 |
| 2022 | $6,117 | $515,055 | $381,425 | $133,630 |
| 2021 | $6,001 | $504,957 | $373,947 | $131,010 |
| 2019 | $5,828 | $489,981 | $362,856 | $127,125 |
| 2018 | $5,616 | $480,375 | $355,742 | $124,633 |
| 2016 | $5,357 | $461,724 | $341,929 | $119,795 |
| 2015 | $5,241 | $454,789 | $336,793 | $117,996 |
| 2014 | $5,107 | $445,881 | $330,196 | $115,685 |
Source: Public Records
Map
Nearby Homes
- 21513 Palos Verdes Blvd
- 21345 Hawthorne Blvd Unit 217
- 21345 Hawthorne Blvd
- 4402 Cathann St
- 4826 Maricopa St
- 4830 Maricopa St
- 22305 Ladeene Ave
- 4814 Asteria St
- 22516 Marjorie Ave
- 1108 Camino Real Unit 407
- 1108 Camino Real Unit 409
- 1108 Camino Real Unit 306
- 1200 Opal St Unit 7
- 1200 Opal St Unit 22
- 22721 Marjorie Ave
- 20706 Mansel Ave
- 603 S Prospect Ave Unit 305
- 603 S Prospect Ave Unit 205
- 635 S Prospect Ave Unit 102
- 641 S Prospect Ave Unit 103
- 21609 Evalyn Ave
- 21601 Evalyn Ave
- 21606 Reynolds Dr
- 21613 Evalyn Ave
- 21513 Evalyn Ave
- 21610 Reynolds Dr
- 21602 Reynolds Dr
- 21514 Reynolds Dr
- 21612 Reynolds Dr
- 21606 Evalyn Ave
- 21617 Evalyn Ave
- 21509 Evalyn Ave
- 21610 Evalyn Ave
- 21602 Evalyn Ave
- 21614 Evalyn Ave
- 21616 Reynolds Dr
- 21510 Reynolds Dr
- 21514 Evalyn Ave
- 21505 Evalyn Ave
- 21701 Evalyn Ave