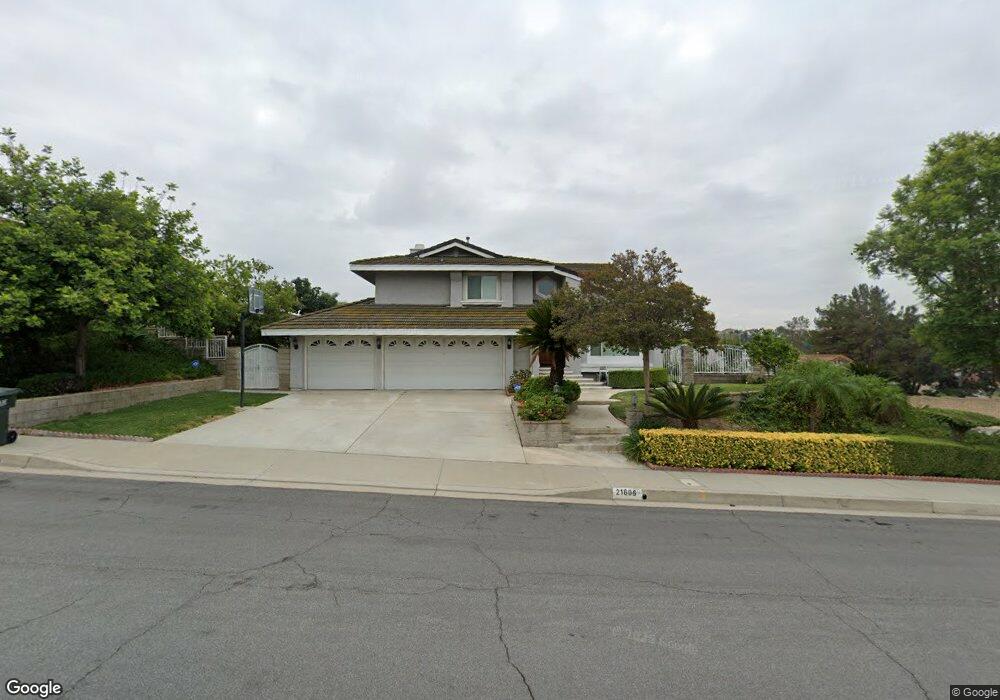
21606 E Sleepy Hollow Ct Walnut, CA 91789
Estimated Value: $1,395,363 - $1,630,000
3
Beds
3
Baths
2,180
Sq Ft
$696/Sq Ft
Est. Value
About This Home
This home is located at 21606 E Sleepy Hollow Ct, Walnut, CA 91789 and is currently estimated at $1,517,091, approximately $695 per square foot. 21606 E Sleepy Hollow Ct is a home located in Los Angeles County with nearby schools including Collegewood Elementary School, Suzanne Middle School, and Walnut High School.
Ownership History
Date
Name
Owned For
Owner Type
Purchase Details
Closed on
Oct 11, 2022
Sold by
Bolor-Dela Cruz Family Trust
Bought by
Erlinda Bolor De La Cruz Revocable Trust
Current Estimated Value
Purchase Details
Closed on
Jul 2, 2015
Sold by
Bolor Erlinda D
Bought by
The Bolor Dela Cruz Family Trust
Purchase Details
Closed on
Jan 24, 2013
Sold by
Bolor Erlinda D and Dela Cruz Jesus
Bought by
Bolor Erlinda and Dela Cruz Jesus
Home Financials for this Owner
Home Financials are based on the most recent Mortgage that was taken out on this home.
Original Mortgage
$324,000
Interest Rate
3.6%
Mortgage Type
New Conventional
Purchase Details
Closed on
May 24, 1994
Sold by
Angelo Daniel D and Angelo Norma E
Bought by
Bolor Erlinda D
Home Financials for this Owner
Home Financials are based on the most recent Mortgage that was taken out on this home.
Original Mortgage
$267,000
Interest Rate
8.53%
Create a Home Valuation Report for This Property
The Home Valuation Report is an in-depth analysis detailing your home's value as well as a comparison with similar homes in the area
Home Values in the Area
Average Home Value in this Area
Purchase History
| Date | Buyer | Sale Price | Title Company |
|---|---|---|---|
| Erlinda Bolor De La Cruz Revocable Trust | -- | -- | |
| The Bolor Dela Cruz Family Trust | -- | None Available | |
| Bolor Erlinda | -- | Servicelink | |
| Bolor Erlinda D | $307,000 | Investors Title Company |
Source: Public Records
Mortgage History
| Date | Status | Borrower | Loan Amount |
|---|---|---|---|
| Previous Owner | Bolor Erlinda | $324,000 | |
| Previous Owner | Bolor Erlinda D | $267,000 |
Source: Public Records
Tax History
| Year | Tax Paid | Tax Assessment Tax Assessment Total Assessment is a certain percentage of the fair market value that is determined by local assessors to be the total taxable value of land and additions on the property. | Land | Improvement |
|---|---|---|---|---|
| 2025 | $8,289 | $646,495 | $196,511 | $449,984 |
| 2024 | $8,289 | $633,819 | $192,658 | $441,161 |
| 2023 | $8,097 | $621,392 | $188,881 | $432,511 |
| 2022 | $7,937 | $609,209 | $185,178 | $424,031 |
| 2021 | $7,792 | $597,265 | $181,548 | $415,717 |
| 2020 | $7,698 | $591,142 | $179,687 | $411,455 |
| 2019 | $7,557 | $579,552 | $176,164 | $403,388 |
| 2018 | $7,229 | $568,189 | $172,710 | $395,479 |
| 2016 | $6,716 | $546,127 | $166,004 | $380,123 |
| 2015 | $6,733 | $537,925 | $163,511 | $374,414 |
| 2014 | $6,767 | $527,389 | $160,309 | $367,080 |
Source: Public Records
Map
Nearby Homes
- 973 Ichabod Way
- 805 Silver Valley Trail
- 21819 E Chestnut Ct
- 931 Sky Meadow Place
- 22045 Tuscany Ct
- 1359 Point Loma Place
- 1371 Point Loma Place
- 22055 Tuscany Ct
- 22057 Tuscany Ct
- 22059 Tuscany Ct
- 22046 Florence Cir
- 22058 Manarola Way
- 22060 Florence Cir
- 22060 Manarola Way
- 22085 Manarola Way
- 221 Roma Ct
- 226 Roma Ct
- 22070 Portofino Dr
- 21529 Magnolia St
- 21530 Magnolia St
- 21618 E Sleepy Hollow Ct
- 21624 E Meadowlark Way
- 21618 E Meadowlark Way
- 21626 E Sleepy Hollow Ct
- 958 Watercress Ln
- 21632 E Meadowlark Way
- 21611 E Sleepy Hollow Ct
- 21616 E Meadowlark Way
- 21603 E Sleepy Hollow Ct
- 962 Watercress Ln
- 21619 E Sleepy Hollow Ct
- 21640 E Meadowlark Way
- 973 N Icabod Way
- 21634 E Sleepy Hollow Ct
- 21606 E Meadowlark Way
- 21619 E Laurel Ct
- 968 Watercress Ln
- 21627 E Laurel Ct
- 21650 E Meadowlark Way
- 21611 E Laurel Ct
Your Personal Tour Guide
Ask me questions while you tour the home.