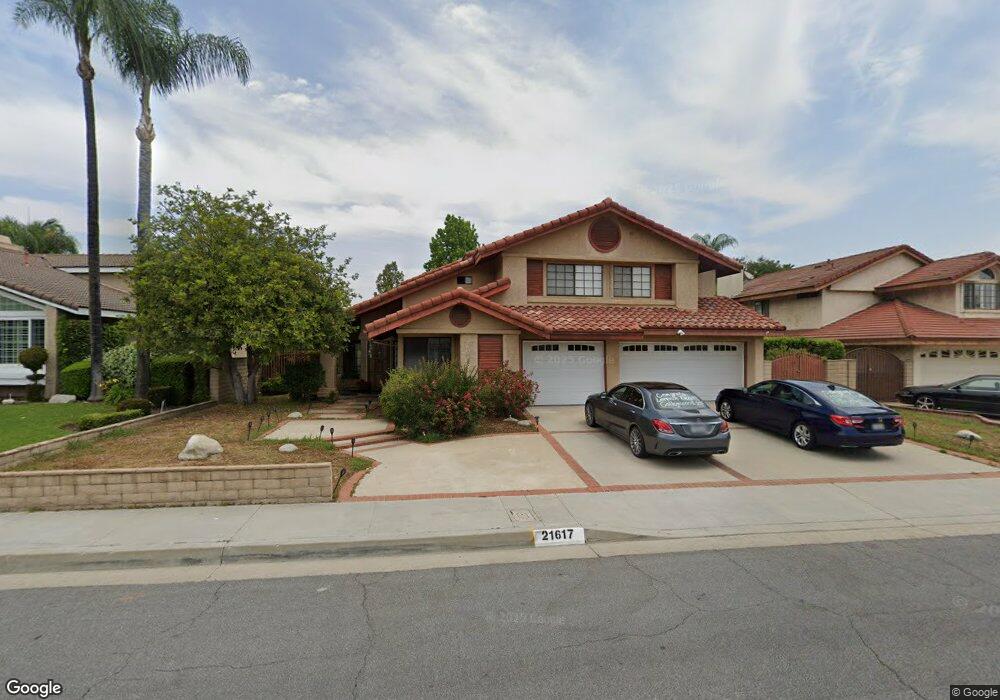
21617 E Deep Creek Rd Walnut, CA 91789
Estimated Value: $1,350,667 - $1,656,000
4
Beds
3
Baths
2,484
Sq Ft
$622/Sq Ft
Est. Value
About This Home
This home is located at 21617 E Deep Creek Rd, Walnut, CA 91789 and is currently estimated at $1,545,167, approximately $622 per square foot. 21617 E Deep Creek Rd is a home located in Los Angeles County with nearby schools including Collegewood Elementary School, Suzanne Middle School, and Walnut High School.
Ownership History
Date
Name
Owned For
Owner Type
Purchase Details
Closed on
Dec 27, 2010
Sold by
The Bank Of New York Mellon
Bought by
Chen Mony Hsu Sen and Chen Juliana Habijono
Current Estimated Value
Home Financials for this Owner
Home Financials are based on the most recent Mortgage that was taken out on this home.
Original Mortgage
$378,000
Outstanding Balance
$255,729
Interest Rate
4.62%
Mortgage Type
New Conventional
Estimated Equity
$1,289,438
Purchase Details
Closed on
Feb 10, 2010
Sold by
Cho Hei Ok
Bought by
The Bank Of New York Mellon and The Bank Of New York
Purchase Details
Closed on
Mar 27, 2000
Sold by
Trust La Londe Robert And Ann Trs La Lon
Bought by
Cho Hei Ok
Home Financials for this Owner
Home Financials are based on the most recent Mortgage that was taken out on this home.
Original Mortgage
$260,000
Interest Rate
8.25%
Mortgage Type
Stand Alone First
Purchase Details
Closed on
Dec 14, 1994
Sold by
Lalonde Robert F and Lalonde Ann Marie
Bought by
Lalonde Robert Franklin
Create a Home Valuation Report for This Property
The Home Valuation Report is an in-depth analysis detailing your home's value as well as a comparison with similar homes in the area
Home Values in the Area
Average Home Value in this Area
Purchase History
| Date | Buyer | Sale Price | Title Company |
|---|---|---|---|
| Chen Mony Hsu Sen | $690,000 | Lsi Title Company | |
| The Bank Of New York Mellon | $770,446 | Landsafe Title | |
| Cho Hei Ok | $408,000 | Fidelity Title | |
| Lalonde Robert Franklin | -- | -- | |
| Lalonde Robert Franklin | -- | -- |
Source: Public Records
Mortgage History
| Date | Status | Borrower | Loan Amount |
|---|---|---|---|
| Open | Chen Mony Hsu Sen | $378,000 | |
| Previous Owner | Cho Hei Ok | $260,000 |
Source: Public Records
Tax History
| Year | Tax Paid | Tax Assessment Tax Assessment Total Assessment is a certain percentage of the fair market value that is determined by local assessors to be the total taxable value of land and additions on the property. | Land | Improvement |
|---|---|---|---|---|
| 2025 | $10,950 | $883,999 | $402,668 | $481,331 |
| 2024 | $10,950 | $866,667 | $394,773 | $471,894 |
| 2023 | $10,690 | $849,675 | $387,033 | $462,642 |
| 2022 | $10,476 | $833,016 | $379,445 | $453,571 |
| 2021 | $10,284 | $816,683 | $372,005 | $444,678 |
| 2019 | $9,968 | $792,462 | $360,972 | $431,490 |
| 2018 | $9,584 | $776,925 | $353,895 | $423,030 |
| 2016 | $8,895 | $746,757 | $340,153 | $406,604 |
| 2015 | $8,927 | $735,541 | $335,044 | $400,497 |
| 2014 | $8,957 | $721,133 | $328,481 | $392,652 |
Source: Public Records
Map
Nearby Homes
- 21819 E Chestnut Ct
- 22046 Florence Cir
- 21530 Magnolia St
- 21529 Magnolia St
- 221 Roma Ct
- 22060 Florence Cir
- 226 Roma Ct
- 242 Solaro Ct
- 351 Spur Trail Ave
- 261 Vomero Ct
- 22025 Florence Cir
- 22045 Tuscany Ct
- 22055 Tuscany Ct
- 805 Silver Valley Trail
- 0 Gartel Dr
- 22057 Tuscany Ct
- 22058 Manarola Way
- 970 Estate Ct
- 22060 Manarola Way
- 22059 Tuscany Ct
- 21625 E Deep Creek Rd
- 21609 E Deep Creek Rd
- 21630 Brookside Ct
- 21638 Brookside Ct
- 21631 E Deep Creek Rd
- 21603 E Deep Creek Rd
- 21622 Brookside Ct
- 21616 E Deep Creek Rd
- 21644 Brookside Ct
- 21606 E Deep Creek Rd
- 21624 E Deep Creek Rd
- 21650 Brookside Ct
- 21639 E Deep Creek Rd
- 21630 E Deep Creek Rd
- 21612 Brookside Ct
- 21625 Brookside Ct
- 21604 Brookside Ct
- 21638 E Deep Creek Rd
- 21635 Brookside Ct
- 21603 Cattail Ct
Your Personal Tour Guide
Ask me questions while you tour the home.