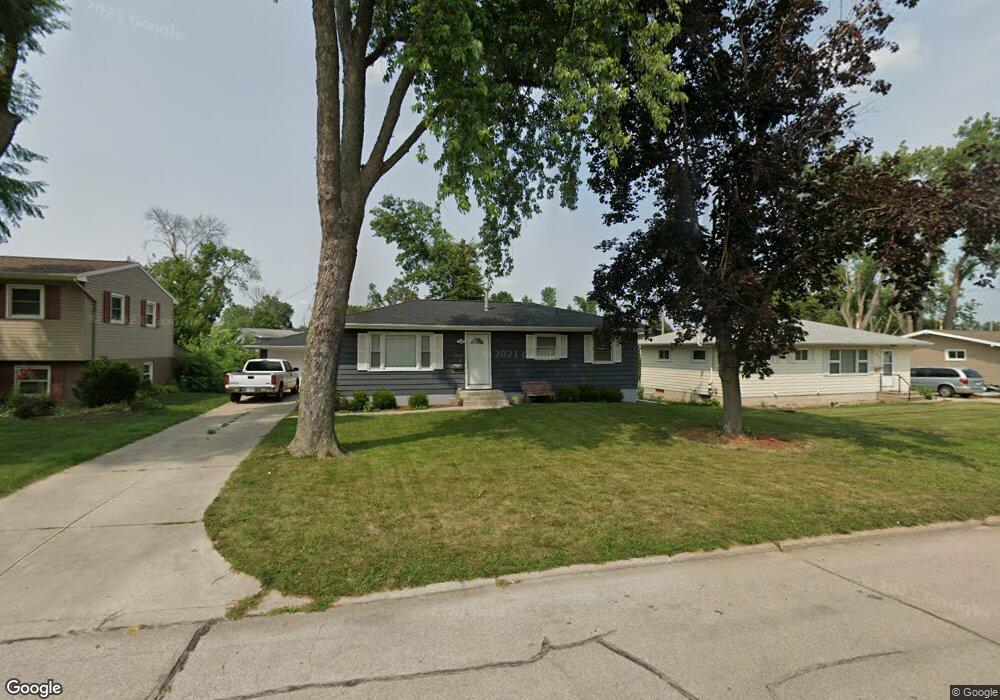
2162 Brookland Dr NE Cedar Rapids, IA 52402
Estimated Value: $177,000 - $203,000
3
Beds
2
Baths
1,008
Sq Ft
$189/Sq Ft
Est. Value
About This Home
This home is located at 2162 Brookland Dr NE, Cedar Rapids, IA 52402 and is currently estimated at $190,245, approximately $188 per square foot. 2162 Brookland Dr NE is a home located in Linn County with nearby schools including Pierce Elementary School, Franklin Middle School, and John F. Kennedy High School.
Ownership History
Date
Name
Owned For
Owner Type
Purchase Details
Closed on
Jan 13, 2022
Sold by
Rogers Jason J
Bought by
Neighbor Austin and Neighbor Jordan
Current Estimated Value
Purchase Details
Closed on
Aug 9, 2006
Sold by
Gallo Samuel U and Gallo Laura L
Bought by
Rogers Jason J
Home Financials for this Owner
Home Financials are based on the most recent Mortgage that was taken out on this home.
Original Mortgage
$122,850
Interest Rate
6.37%
Mortgage Type
Unknown
Purchase Details
Closed on
Jun 10, 2002
Sold by
Martens Mark A and Martens Amy L
Bought by
Gallo Samuel U and Gallo Laura L
Home Financials for this Owner
Home Financials are based on the most recent Mortgage that was taken out on this home.
Original Mortgage
$107,100
Interest Rate
6.95%
Purchase Details
Closed on
Aug 26, 1999
Sold by
Meyer Mable
Bought by
Meyer John L
Create a Home Valuation Report for This Property
The Home Valuation Report is an in-depth analysis detailing your home's value as well as a comparison with similar homes in the area
Home Values in the Area
Average Home Value in this Area
Purchase History
| Date | Buyer | Sale Price | Title Company |
|---|---|---|---|
| Neighbor Austin | $148,000 | None Listed On Document | |
| Rogers Jason J | $136,000 | None Available | |
| Gallo Samuel U | $118,500 | -- | |
| Meyer John L | -- | -- |
Source: Public Records
Mortgage History
| Date | Status | Borrower | Loan Amount |
|---|---|---|---|
| Previous Owner | Rogers Jason J | $122,850 | |
| Previous Owner | Gallo Samuel U | $107,100 |
Source: Public Records
Tax History Compared to Growth
Tax History
| Year | Tax Paid | Tax Assessment Tax Assessment Total Assessment is a certain percentage of the fair market value that is determined by local assessors to be the total taxable value of land and additions on the property. | Land | Improvement |
|---|---|---|---|---|
| 2025 | $3,082 | $192,400 | $43,100 | $149,300 |
| 2024 | $3,138 | $174,200 | $39,700 | $134,500 |
| 2023 | $3,138 | $174,200 | $39,700 | $134,500 |
| 2022 | $2,910 | $148,800 | $34,500 | $114,300 |
| 2021 | $3,050 | $140,500 | $32,800 | $107,700 |
| 2020 | $3,050 | $138,200 | $29,300 | $108,900 |
| 2019 | $2,828 | $131,200 | $27,600 | $103,600 |
| 2018 | $2,750 | $131,200 | $27,600 | $103,600 |
| 2017 | $2,592 | $124,800 | $27,600 | $97,200 |
| 2016 | $2,592 | $121,900 | $27,600 | $94,300 |
| 2015 | $2,637 | $123,947 | $31,059 | $92,888 |
| 2014 | $2,452 | $123,947 | $31,059 | $92,888 |
| 2013 | $2,396 | $123,947 | $31,059 | $92,888 |
Source: Public Records
Map
Nearby Homes
- 3858 Northwood Dr NE
- 2106 42nd St NE
- 2400 Brookland Dr NE
- 4216 Marilyn Dr NE
- 2041 Birchwood Dr NE
- 2520 Falbrook Dr NE
- 2445 Glass Rd NE
- 2611 Brookland Dr NE
- 4609 White Pine Dr NE
- 3604 Heatheridge Dr NE
- 1611 Hollywood Blvd NE
- 1721 34th St NE
- 4460 Westchester Dr NE Unit C
- 3008 Circle Hill Ct NE
- 1638 47th St NE
- 1006 Messina Dr NE
- 1138 Messina Dr NE
- 4309 Benton St NE
- 2962 Circle Dr NE
- 4545 Westchester Dr NE Unit D
- 2156 Brookland Dr NE
- 2168 Brookland Dr NE
- 3901 Richard Dr NE
- 3836 Terrace Hill Dr NE
- 2143 Richard Dr NE
- 2169 Brookland Dr NE
- 2161 Brookland Dr NE
- 2140 Brookland Dr NE
- 3822 Terrace Hill Dr NE
- 3844 Terrace Hill Dr NE
- 2137 Richard Dr NE
- 3814 Terrace Hill Dr NE
- 3911 Richard Dr NE
- 3850 Terrace Hill Dr NE
- 3814 Lynbrook Dr NE
- 2130 Brookland Dr NE
- 2131 Richard Dr NE
- 3801 Lynbrook Dr NE
- 3806 Terrace Hill Dr NE
- 3858 Terrace Hill Dr NE