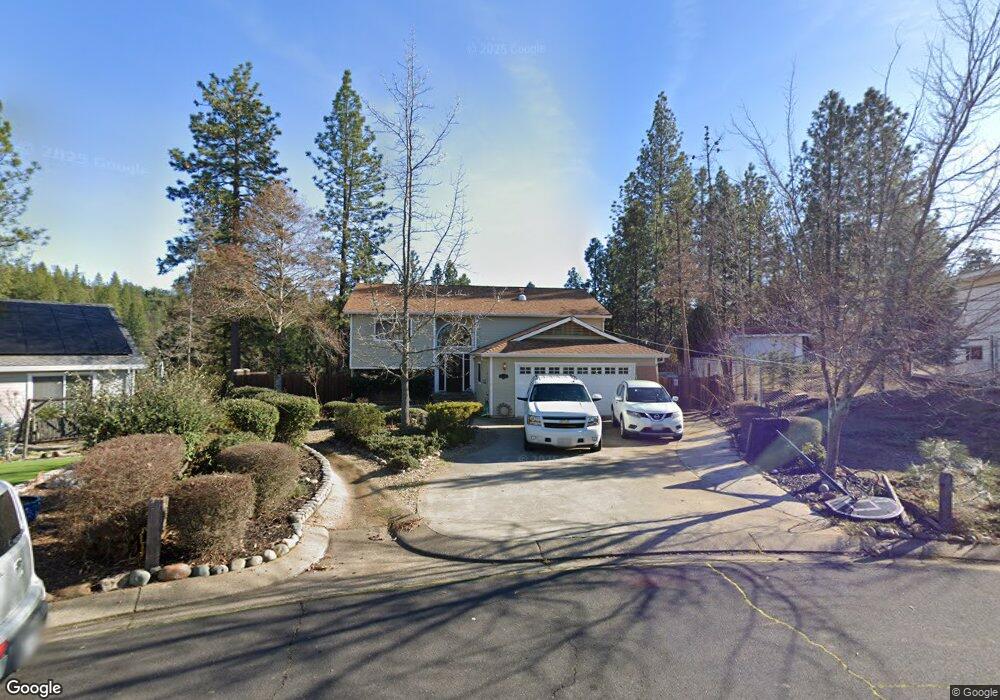
21620 Bills Ct Pine Grove, CA 95665
Estimated Value: $448,518 - $510,000
3
Beds
2
Baths
2,536
Sq Ft
$187/Sq Ft
Est. Value
About This Home
This home is located at 21620 Bills Ct, Pine Grove, CA 95665 and is currently estimated at $474,130, approximately $186 per square foot. 21620 Bills Ct is a home located in Amador County with nearby schools including Pine Grove Elementary STEM School, Jackson Junior High School, and Argonaut High School.
Ownership History
Date
Name
Owned For
Owner Type
Purchase Details
Closed on
Mar 16, 2021
Sold by
Switzer Wilbur J and Switzer Kathleen M
Bought by
Vanderford Amanda and Perkins Michael
Current Estimated Value
Home Financials for this Owner
Home Financials are based on the most recent Mortgage that was taken out on this home.
Original Mortgage
$372,060
Outstanding Balance
$333,525
Interest Rate
2.7%
Mortgage Type
FHA
Estimated Equity
$140,605
Purchase Details
Closed on
Aug 17, 2007
Sold by
Switzer Wilbur James and Switzer Kathleen Mary
Bought by
Switzer Wilbur J and Switzer Kathleen M
Home Financials for this Owner
Home Financials are based on the most recent Mortgage that was taken out on this home.
Original Mortgage
$75,000
Interest Rate
6.62%
Mortgage Type
Credit Line Revolving
Create a Home Valuation Report for This Property
The Home Valuation Report is an in-depth analysis detailing your home's value as well as a comparison with similar homes in the area
Home Values in the Area
Average Home Value in this Area
Purchase History
| Date | Buyer | Sale Price | Title Company |
|---|---|---|---|
| Vanderford Amanda | $375,000 | First American Title Company | |
| Switzer Wilbur J | -- | First American Title Company |
Source: Public Records
Mortgage History
| Date | Status | Borrower | Loan Amount |
|---|---|---|---|
| Open | Vanderford Amanda | $372,060 | |
| Previous Owner | Switzer Wilbur J | $75,000 |
Source: Public Records
Tax History Compared to Growth
Tax History
| Year | Tax Paid | Tax Assessment Tax Assessment Total Assessment is a certain percentage of the fair market value that is determined by local assessors to be the total taxable value of land and additions on the property. | Land | Improvement |
|---|---|---|---|---|
| 2025 | $4,612 | $456,784 | $92,006 | $364,778 |
| 2024 | $4,612 | $447,828 | $90,202 | $357,626 |
| 2023 | $4,521 | $439,048 | $88,434 | $350,614 |
| 2022 | $4,404 | $430,440 | $86,700 | $343,740 |
| 2021 | $2,391 | $231,694 | $43,435 | $188,259 |
| 2020 | $2,368 | $229,319 | $42,990 | $186,329 |
| 2019 | $2,321 | $224,824 | $42,148 | $182,676 |
| 2018 | $2,277 | $220,417 | $41,322 | $179,095 |
| 2017 | $2,233 | $216,096 | $40,512 | $175,584 |
| 2016 | $2,189 | $211,860 | $39,718 | $172,142 |
| 2015 | $2,158 | $208,679 | $39,122 | $169,557 |
| 2014 | $2,115 | $204,592 | $38,356 | $166,236 |
Source: Public Records
Map
Nearby Homes
- 21750 Homestead Rd
- 21821 Homestead Rd
- 12105 Blackberry Ln
- 14100 Greenleaf Ln
- 0 Homestead Unit 225020801
- 22256 Valley View Ct
- 21000 French Gulch Rd
- 22596 Alaire Ln
- 22800 Alaire Ln
- 20117 Neilson Rd
- 23205 Roden Ln
- 10500 Tabeaud Rd
- 10440 Tabeaud Rd
- 19934 Pitts Ct
- 20070 Tellurium Dr
- 14671 Marilyn Ln
- 13851 Tank Ct
- 11650 Clinton Bar Rd
- 14074 Irishtown Rd Unit 40
- 19475 Murphy Rd