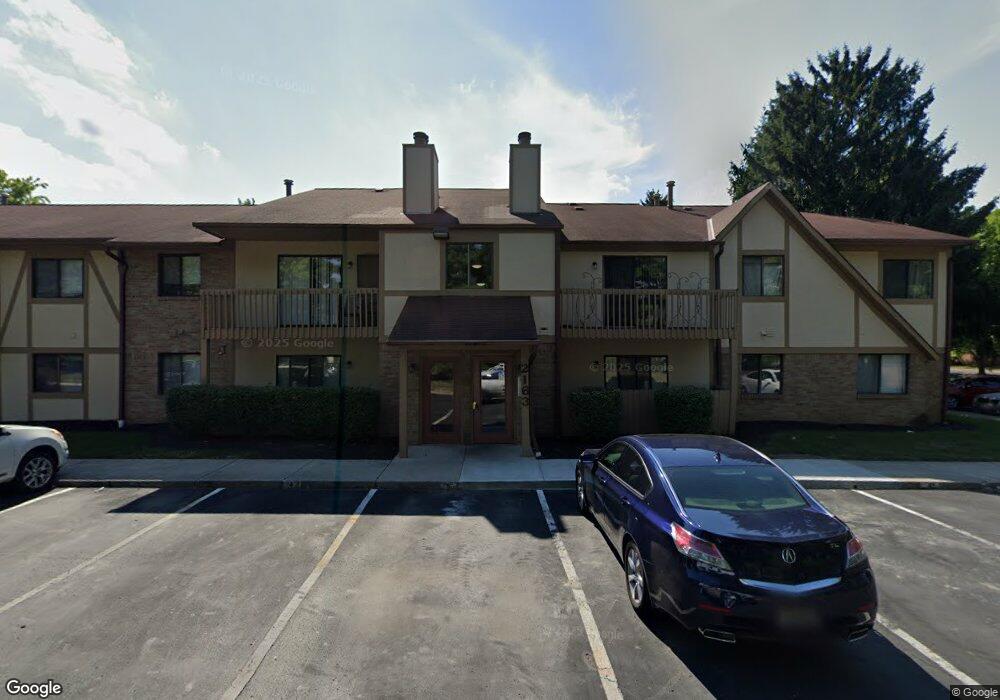
2163 Hedgerow Rd Unit 2163C Columbus, OH 43220
Northcrest NeighborhoodEstimated Value: $161,000 - $185,000
2
Beds
1
Bath
932
Sq Ft
$182/Sq Ft
Est. Value
About This Home
This home is located at 2163 Hedgerow Rd Unit 2163C, Columbus, OH 43220 and is currently estimated at $169,346, approximately $181 per square foot. 2163 Hedgerow Rd Unit 2163C is a home located in Franklin County with nearby schools including Winterset Elementary School, Ridgeview Middle School, and Centennial High School.
Ownership History
Date
Name
Owned For
Owner Type
Purchase Details
Closed on
Feb 24, 2005
Sold by
Spetie Dan N and Spetie Lacramioara
Bought by
Southern Magnolia Properties Ltd
Current Estimated Value
Purchase Details
Closed on
Sep 30, 2004
Sold by
Tatiana Zakharevskaia and Zakharevski Vassili
Bought by
Spetie Dan and Spetie Lacra Mioara
Purchase Details
Closed on
Sep 11, 2001
Sold by
Bcg Investment Co
Bought by
Tatiana Zakharevski Vassili and Tatiana Zakharevskaia
Home Financials for this Owner
Home Financials are based on the most recent Mortgage that was taken out on this home.
Original Mortgage
$43,100
Interest Rate
6.97%
Mortgage Type
Purchase Money Mortgage
Purchase Details
Closed on
Jul 29, 1992
Bought by
Bcg Investment Co
Purchase Details
Closed on
Jun 2, 1992
Purchase Details
Closed on
Nov 1, 1985
Create a Home Valuation Report for This Property
The Home Valuation Report is an in-depth analysis detailing your home's value as well as a comparison with similar homes in the area
Home Values in the Area
Average Home Value in this Area
Purchase History
| Date | Buyer | Sale Price | Title Company |
|---|---|---|---|
| Southern Magnolia Properties Ltd | -- | Northwest T | |
| Spetie Dan | $73,600 | Chicago Tit | |
| Tatiana Zakharevski Vassili | $53,900 | Alliance Title | |
| Bcg Investment Co | $511,000 | -- | |
| -- | $30,000 | -- | |
| -- | $39,800 | -- |
Source: Public Records
Mortgage History
| Date | Status | Borrower | Loan Amount |
|---|---|---|---|
| Previous Owner | Tatiana Zakharevski Vassili | $43,100 |
Source: Public Records
Tax History Compared to Growth
Tax History
| Year | Tax Paid | Tax Assessment Tax Assessment Total Assessment is a certain percentage of the fair market value that is determined by local assessors to be the total taxable value of land and additions on the property. | Land | Improvement |
|---|---|---|---|---|
| 2024 | $2,034 | $44,380 | $10,500 | $33,880 |
| 2023 | $2,008 | $44,380 | $10,500 | $33,880 |
| 2022 | $1,600 | $30,110 | $5,220 | $24,890 |
| 2021 | $1,603 | $30,110 | $5,220 | $24,890 |
| 2020 | $1,605 | $30,110 | $5,220 | $24,890 |
| 2019 | $1,387 | $22,300 | $3,850 | $18,450 |
| 2018 | $1,342 | $22,300 | $3,850 | $18,450 |
| 2017 | $1,407 | $22,300 | $3,850 | $18,450 |
| 2016 | $1,427 | $21,000 | $3,710 | $17,290 |
| 2015 | $1,299 | $21,000 | $3,710 | $17,290 |
| 2014 | $1,302 | $21,000 | $3,710 | $17,290 |
| 2013 | $642 | $21,000 | $3,710 | $17,290 |
Source: Public Records
Map
Nearby Homes
- 5268 Captains Ct
- 5283 Ruthton Rd Unit 19
- 5294 Brandy Oaks Ln
- 5273 Brandy Oaks Ln
- 2229 Teardrop Ave Unit 35E
- 1865 Willoway Cir N Unit 1865
- 5624 Wigmore Dr Unit 50B
- 2540 Dahlia Way Unit 26D
- 2491 Calais Way
- 5108 Ranstead Ct
- 1835 Willoway Cir N
- 2165 Partlow Dr
- 1739 Paula Dr Unit 1739
- 2198 Sandston Rd
- 1683 Saint Albans Ct Unit 22-83
- 2260 Lila Way Unit 62D
- 2231 Atlee Ct Unit 12
- 2560 Trotterslane Dr
- 2585 Trottersway Dr Unit 2585
- 5111 Schuylkill St
- 2163 Hedgerow Rd Unit 2163G
- 2163 Hedgerow Rd Unit 2163F
- 2163 Hedgerow Rd
- 2163 Hedgerow Rd
- 2163 Hedgerow Rd
- 2163 Hedgerow Rd
- 2163 Hedgerow Rd Unit D
- 2163 Hedgerow Rd Unit B
- 2163 Hedgerow Rd Unit G
- 2163 Hedgerow Rd Unit A
- 2163 Hedgerow Rd Unit H
- 2163 Hedgerow Rd Unit 2163D
- 2159 Hedgerow Rd Unit 2159F
- 2159 Hedgerow Rd Unit 2159B
- 2159 Hedgerow Rd Unit 2159D
- 2159 Hedgerow Rd Unit 2159C
- 2159 Hedgerow Rd Unit 2159A
- 2159 Hedgerow Rd Unit 2159G
- 2159 Hedgerow Rd
- 2159 Hedgerow Rd Unit 2159H