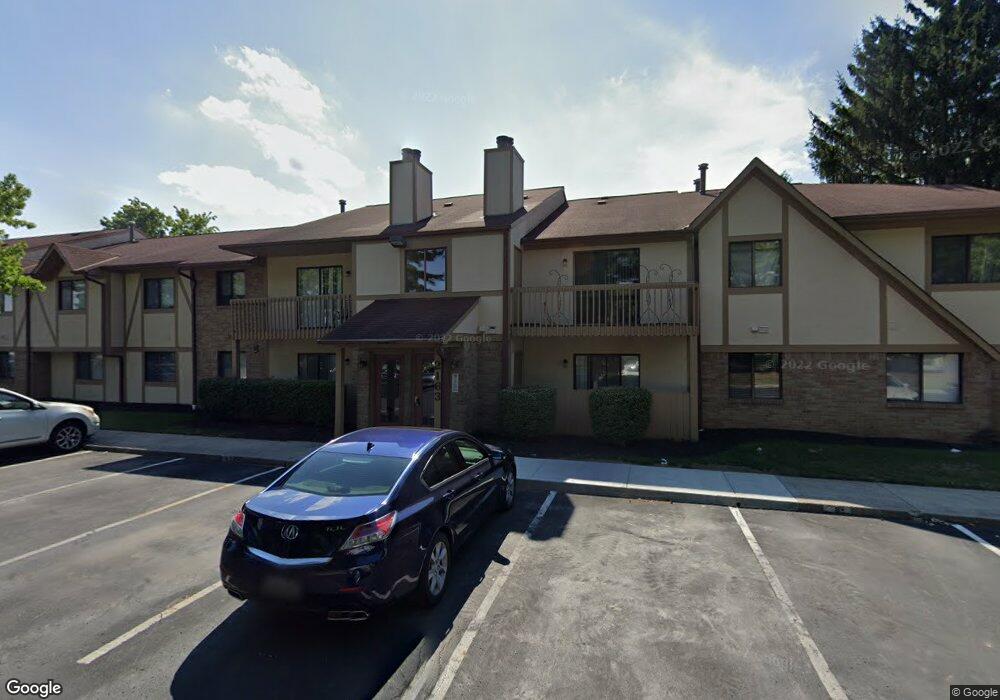
2163 Hedgerow Rd Columbus, OH 43220
Northcrest NeighborhoodEstimated Value: $157,000 - $189,000
2
Beds
1
Bath
952
Sq Ft
$178/Sq Ft
Est. Value
About This Home
This home is located at 2163 Hedgerow Rd, Columbus, OH 43220 and is currently estimated at $169,758, approximately $178 per square foot. 2163 Hedgerow Rd is a home located in Franklin County with nearby schools including Winterset Elementary School, Ridgeview Middle School, and Centennial High School.
Ownership History
Date
Name
Owned For
Owner Type
Purchase Details
Closed on
Jul 21, 2017
Sold by
Chakravarthy Balaji
Bought by
Ecb Equities Llc
Current Estimated Value
Home Financials for this Owner
Home Financials are based on the most recent Mortgage that was taken out on this home.
Original Mortgage
$63,900
Outstanding Balance
$11,240
Interest Rate
3.9%
Mortgage Type
Commercial
Estimated Equity
$158,518
Purchase Details
Closed on
Jul 12, 2017
Sold by
Ali Seemaab
Bought by
Chakravarthy Balaji
Home Financials for this Owner
Home Financials are based on the most recent Mortgage that was taken out on this home.
Original Mortgage
$63,900
Outstanding Balance
$11,240
Interest Rate
3.9%
Mortgage Type
Commercial
Estimated Equity
$158,518
Purchase Details
Closed on
Jun 30, 2014
Sold by
Gubin Vladislav
Bought by
Ali Seemaab
Purchase Details
Closed on
Mar 26, 2002
Sold by
Bcg Investment Co
Bought by
Gubin Vladislav
Purchase Details
Closed on
Jul 29, 1992
Bought by
Bcg Investment Co
Purchase Details
Closed on
Jun 2, 1992
Purchase Details
Closed on
Nov 1, 1985
Create a Home Valuation Report for This Property
The Home Valuation Report is an in-depth analysis detailing your home's value as well as a comparison with similar homes in the area
Home Values in the Area
Average Home Value in this Area
Purchase History
| Date | Buyer | Sale Price | Title Company |
|---|---|---|---|
| Ecb Equities Llc | -- | Elite Land Title | |
| Chakravarthy Balaji | $79,900 | Elite Land Title | |
| Ali Seemaab | $69,000 | Valmer Land Title Agency Box | |
| Gubin Vladislav | $54,500 | Alliance Title | |
| Bcg Investment Co | $511,000 | -- | |
| -- | $30,000 | -- | |
| -- | $39,800 | -- |
Source: Public Records
Mortgage History
| Date | Status | Borrower | Loan Amount |
|---|---|---|---|
| Open | Ecb Equities Llc | $63,900 |
Source: Public Records
Tax History
| Year | Tax Paid | Tax Assessment Tax Assessment Total Assessment is a certain percentage of the fair market value that is determined by local assessors to be the total taxable value of land and additions on the property. | Land | Improvement |
|---|---|---|---|---|
| 2025 | $2,055 | $44,840 | $10,500 | $34,340 |
| 2024 | $2,055 | $44,840 | $10,500 | $34,340 |
| 2023 | $2,029 | $44,840 | $10,500 | $34,340 |
| 2022 | $1,619 | $30,460 | $5,220 | $25,240 |
| 2021 | $1,622 | $30,460 | $5,220 | $25,240 |
| 2020 | $1,624 | $30,460 | $5,220 | $25,240 |
| 2019 | $1,402 | $22,540 | $3,850 | $18,690 |
| 2018 | $1,363 | $22,540 | $3,850 | $18,690 |
| 2017 | $1,401 | $22,540 | $3,850 | $18,690 |
| 2016 | $1,461 | $22,060 | $2,840 | $19,220 |
| 2015 | $1,327 | $22,060 | $2,840 | $19,220 |
| 2014 | $1,368 | $22,060 | $2,840 | $19,220 |
| 2013 | $675 | $22,050 | $2,835 | $19,215 |
Source: Public Records
Map
Nearby Homes
- 2176 Hedgerow Rd Unit 2176D
- 5268 Captains Ct
- 5258 Captains Ct Unit E
- 2071 Tamarin Dr Unit 9C
- 5294 Brandy Oaks Ln
- 5273 Brandy Oaks Ln
- 5233 Brandy Oaks Ln Unit 5233
- 1883 Willoway Cir N Unit 1883
- 1916 Willoway Cir S
- 2515 Dahlia Way Unit 64C
- 5108 Ranstead Ct
- 5107 Delancey St
- 5348 Shannon Ln Unit 68
- 5624 Wigmore Dr Unit 50B
- 2540 Dahlia Way Unit 26D
- 2158 Sandston Rd
- 5354 Shannon Ln Unit 71
- 2542 Hyacinth Ln Unit 32C
- 2242 Atlee Ct Unit 5
- 2544 Maxim Ln Unit 37C
- 2163 Hedgerow Rd Unit 2163C
- 2163 Hedgerow Rd Unit 2163G
- 2163 Hedgerow Rd Unit 2163F
- 2163 Hedgerow Rd
- 2163 Hedgerow Rd
- 2163 Hedgerow Rd
- 2163 Hedgerow Rd Unit E
- 2163 Hedgerow Rd Unit D
- 2163 Hedgerow Rd Unit B
- 2163 Hedgerow Rd Unit G
- 2163 Hedgerow Rd Unit A
- 2163 Hedgerow Rd Unit H
- 2163 Hedgerow Rd Unit 2163D
- 2159 Hedgerow Rd Unit 2159F
- 2159 Hedgerow Rd Unit 2159B
- 2159 Hedgerow Rd Unit 2159D
- 2159 Hedgerow Rd Unit 2159C
- 2159 Hedgerow Rd Unit 2159A
- 2159 Hedgerow Rd Unit 2159G
- 2159 Hedgerow Rd
Your Personal Tour Guide
Ask me questions while you tour the home.