2163 Highway 82 S Shelbyville, TN 37160
Estimated Value: $538,000 - $750,000
--
Bed
--
Bath
2,859
Sq Ft
$214/Sq Ft
Est. Value
About This Home
This home is located at 2163 Highway 82 S, Shelbyville, TN 37160 and is currently estimated at $611,463, approximately $213 per square foot. 2163 Highway 82 S is a home located in Bedford County with nearby schools including Liberty Elementary School.
Ownership History
Date
Name
Owned For
Owner Type
Purchase Details
Closed on
Aug 31, 2018
Sold by
Thacker James Wesley
Bought by
Shulda Randy and Shulda Carrie
Current Estimated Value
Home Financials for this Owner
Home Financials are based on the most recent Mortgage that was taken out on this home.
Original Mortgage
$232,000
Outstanding Balance
$201,483
Interest Rate
4.5%
Mortgage Type
New Conventional
Estimated Equity
$409,980
Purchase Details
Closed on
Oct 29, 2015
Sold by
Logan John
Bought by
Thacker James Wesley
Purchase Details
Closed on
Dec 3, 1997
Bought by
Logan John and Logan Rose
Home Financials for this Owner
Home Financials are based on the most recent Mortgage that was taken out on this home.
Original Mortgage
$114,750
Interest Rate
7.26%
Purchase Details
Closed on
May 10, 1995
Bought by
Matlock Billy J
Purchase Details
Closed on
Aug 16, 1993
Bought by
Hix Kelley R and Hix Elsie M
Purchase Details
Closed on
Dec 18, 1948
Bought by
Hix Kelley R
Create a Home Valuation Report for This Property
The Home Valuation Report is an in-depth analysis detailing your home's value as well as a comparison with similar homes in the area
Home Values in the Area
Average Home Value in this Area
Purchase History
| Date | Buyer | Sale Price | Title Company |
|---|---|---|---|
| Shulda Randy | $290,000 | Access Title & Escrow Inc | |
| Thacker James Wesley | $237,500 | -- | |
| Logan John | $135,000 | -- | |
| Matlock Billy J | $117,500 | -- | |
| Hix Kelley R | -- | -- | |
| Hix Kelley R | -- | -- |
Source: Public Records
Mortgage History
| Date | Status | Borrower | Loan Amount |
|---|---|---|---|
| Open | Shulda Randy | $232,000 | |
| Previous Owner | Hix Kelley R | $114,750 |
Source: Public Records
Tax History Compared to Growth
Tax History
| Year | Tax Paid | Tax Assessment Tax Assessment Total Assessment is a certain percentage of the fair market value that is determined by local assessors to be the total taxable value of land and additions on the property. | Land | Improvement |
|---|---|---|---|---|
| 2025 | $2,261 | $97,250 | $0 | $0 |
| 2024 | $2,261 | $97,250 | $39,350 | $57,900 |
| 2023 | $2,261 | $97,250 | $39,350 | $57,900 |
| 2022 | $2,261 | $97,250 | $39,350 | $57,900 |
| 2021 | $1,911 | $97,250 | $39,350 | $57,900 |
| 2020 | $1,573 | $97,250 | $39,350 | $57,900 |
| 2019 | $1,573 | $59,125 | $24,100 | $35,025 |
| 2018 | $1,514 | $59,125 | $24,100 | $35,025 |
| 2017 | $1,514 | $59,125 | $24,100 | $35,025 |
| 2016 | $1,490 | $59,125 | $24,100 | $35,025 |
| 2015 | $1,490 | $59,125 | $24,100 | $35,025 |
| 2014 | $1,181 | $52,005 | $0 | $0 |
Source: Public Records
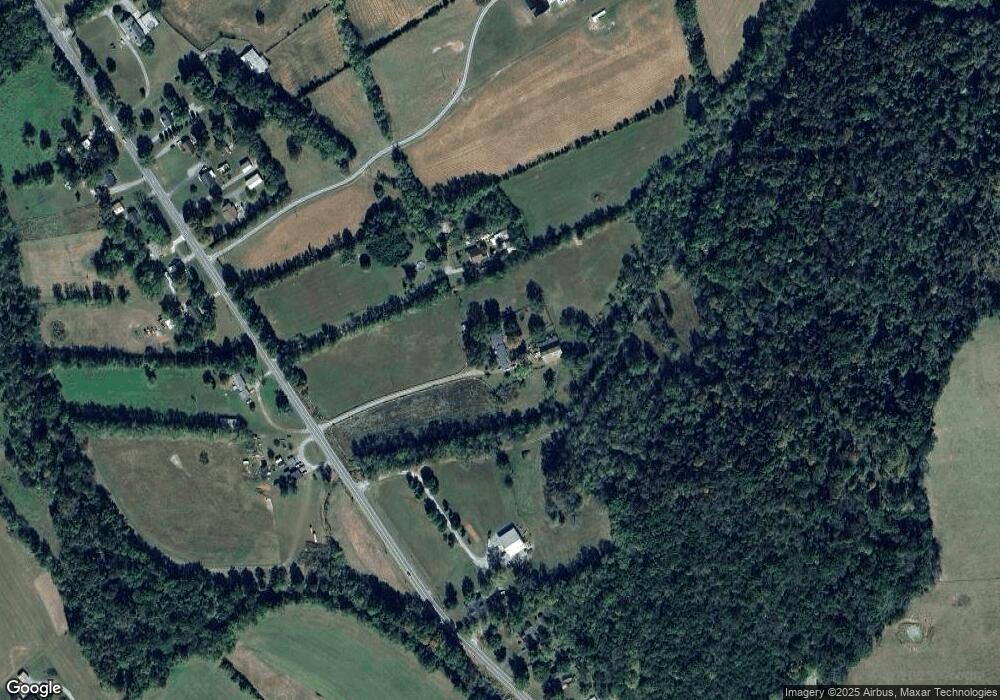
Map
Nearby Homes
- 248 Old Flat Creek Rd
- 176 Corder Ln
- 0 New Center Church Rd
- 506 New Center Church Rd
- 455 Himesville Rd
- 119 Crestland Cir
- 495 Himesville Rd
- 209 Gladys Dr
- 0 Overlook Ln Unit RTC2889952
- 0 Overlook Ln Unit 1513245
- 0 Overlook Ln Unit RTC3015273
- 291 Joe Hart Rd
- 900 New Herman Rd
- 296 Womble Rd
- 231 Riverbend Country Club Rd
- 0 Himesville Rd
- 122 Elijah Parker Rd
- 692 Anderson Rd
- 0 Highway 130 E
- 339 Riverbend Country Club Rd
- 2163 Highway 82 S
- 2161 Highway 82 S
- 2164 Highway 82 S
- 0 Highway 82 S Unit 1758890
- 0 Highway 82 S Unit RTC2545868
- 0 Highway 82 S Unit 2058097
- 2173 Tennessee 82
- 2173 Highway 82 S
- 2160 Highway 82 S
- 2175 Highway 82 S
- 2151 Highway 82 S
- 2154 Highway 82 S
- 2149 Highway 82 S
- 2150 Highway 82 S
- 2145 Highway 82 S
- 2181 Highway 82 S
- 2148 Highway 82 S
- 2143 Highway 82 S
- 2146 Highway 82 S
- 2142 Highway 82 S