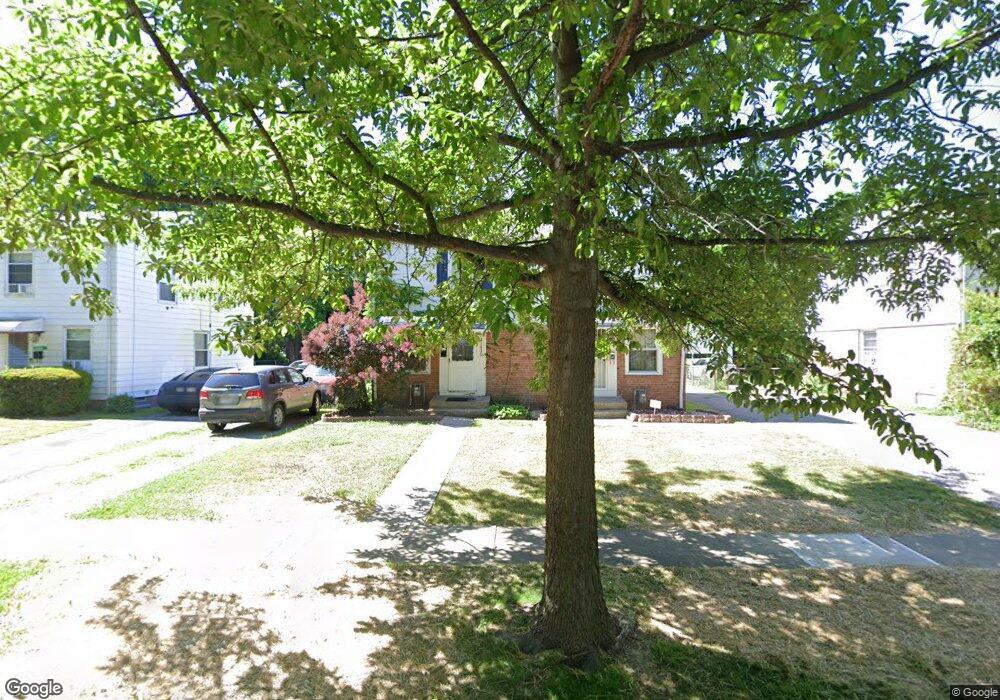
21630 Crystal Ave Euclid, OH 44123
Estimated Value: $65,000 - $94,000
2
Beds
1
Bath
858
Sq Ft
$89/Sq Ft
Est. Value
About This Home
This home is located at 21630 Crystal Ave, Euclid, OH 44123 and is currently estimated at $76,368, approximately $89 per square foot. 21630 Crystal Ave is a home located in Cuyahoga County with nearby schools including Arbor Elementary School, Euclid Middle School, and Euclid High School.
Ownership History
Date
Name
Owned For
Owner Type
Purchase Details
Closed on
Aug 25, 2005
Sold by
Phipps James E and Phipps Karla
Bought by
Smith Shawna C
Current Estimated Value
Home Financials for this Owner
Home Financials are based on the most recent Mortgage that was taken out on this home.
Original Mortgage
$72,500
Outstanding Balance
$42,362
Interest Rate
7.99%
Mortgage Type
Purchase Money Mortgage
Estimated Equity
$34,006
Purchase Details
Closed on
Jul 28, 1995
Sold by
Carrizo Maria E
Bought by
Phipps James
Home Financials for this Owner
Home Financials are based on the most recent Mortgage that was taken out on this home.
Original Mortgage
$44,500
Interest Rate
7.59%
Mortgage Type
New Conventional
Purchase Details
Closed on
Oct 25, 1991
Sold by
Ball Marianna L
Bought by
Carrizo Santiago O
Purchase Details
Closed on
Sep 11, 1986
Sold by
Ball Richard J
Bought by
Ball Marianna L
Purchase Details
Closed on
Jan 1, 1975
Bought by
Ball Richard J
Create a Home Valuation Report for This Property
The Home Valuation Report is an in-depth analysis detailing your home's value as well as a comparison with similar homes in the area
Home Values in the Area
Average Home Value in this Area
Purchase History
| Date | Buyer | Sale Price | Title Company |
|---|---|---|---|
| Smith Shawna C | $72,500 | Authorized | |
| Phipps James | $53,500 | -- | |
| Carrizo Santiago O | $36,500 | -- | |
| Ball Marianna L | -- | -- | |
| Ball Richard J | -- | -- |
Source: Public Records
Mortgage History
| Date | Status | Borrower | Loan Amount |
|---|---|---|---|
| Open | Smith Shawna C | $72,500 | |
| Previous Owner | Phipps James | $44,500 |
Source: Public Records
Tax History
| Year | Tax Paid | Tax Assessment Tax Assessment Total Assessment is a certain percentage of the fair market value that is determined by local assessors to be the total taxable value of land and additions on the property. | Land | Improvement |
|---|---|---|---|---|
| 2025 | $1,667 | $23,590 | $7,105 | $16,485 |
| 2024 | $1,723 | $23,590 | $7,105 | $16,485 |
| 2023 | $1,755 | $19,290 | $5,600 | $13,690 |
| 2022 | $1,687 | $19,290 | $5,600 | $13,690 |
| 2021 | $1,870 | $19,290 | $5,600 | $13,690 |
| 2020 | $1,578 | $14,600 | $4,240 | $10,360 |
| 2019 | $1,414 | $41,700 | $12,100 | $29,600 |
| 2018 | $1,379 | $14,600 | $4,240 | $10,360 |
| 2017 | $1,439 | $12,290 | $2,800 | $9,490 |
| 2016 | $1,442 | $12,290 | $2,800 | $9,490 |
| 2015 | $1,318 | $12,290 | $2,800 | $9,490 |
| 2014 | $1,318 | $12,290 | $2,800 | $9,490 |
Source: Public Records
Map
Nearby Homes
- 21670 Crystal Ave
- 21481 Ball Ave
- 21971 Crystal Ave
- 21391 Westport Ave
- 21181 Ball Ave
- 21000 Crystal Ave
- 21051 S Lake Shore Blvd
- 20931 Priday Ave
- 21300 Wilmore Ave
- 20900 Priday Ave
- 21250 Wilmore Ave
- 21051 Westport Ave
- 21170 Wilmore Ave
- 20700 Crystal Ave
- 324 E 215th St
- 20751 Wilmore Ave
- 273 E 208th St
- 20591 Ball Ave
- 20890 Morris Ave
- 20801 Morris Ave
- 21650 Crystal Ave
- 21590 Crystal Ave
- 21690 Crystal Ave
- 21570 Crystal Ave
- 21710 Crystal Ave
- 21651 Priday Ave
- 21671 Priday Ave
- 465 E 215th St
- 21631 Priday Ave
- 21701 Priday Ave
- 21730 Crystal Ave
- 21571 Priday Ave
- 21721 Priday Ave
- 21750 Crystal Ave
- 21631 Crystal Ave
- 21651 Crystal Ave
- 21611 Crystal Ave
- 21671 Crystal Ave
- 21751 Priday Ave
- 21591 Crystal Ave
Your Personal Tour Guide
Ask me questions while you tour the home.