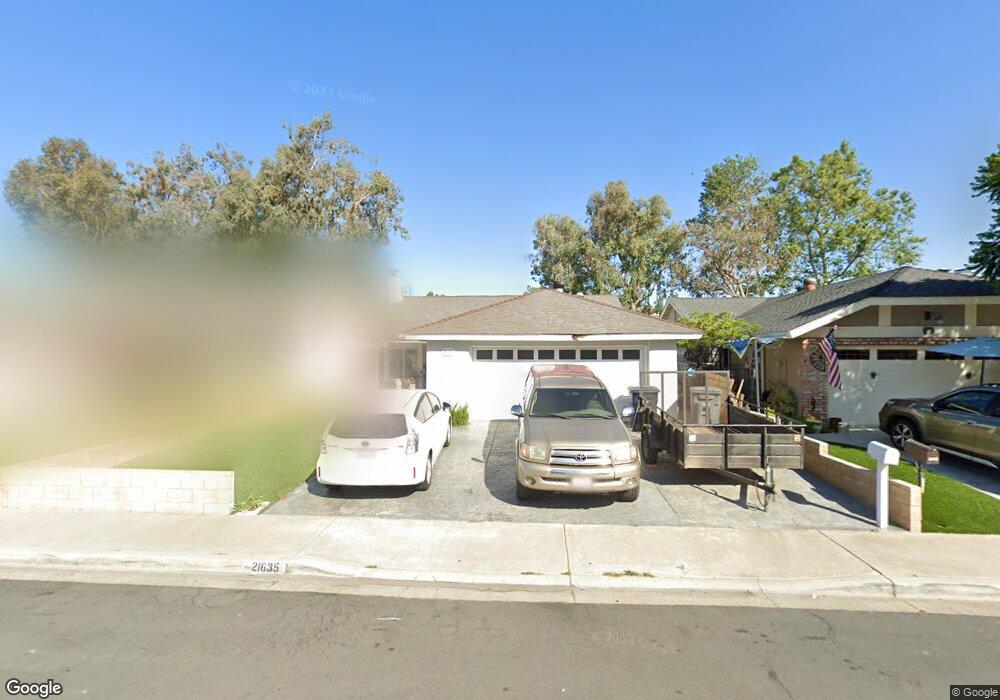
21635 Audubon Way Lake Forest, CA 92630
Estimated Value: $979,644 - $1,079,000
4
Beds
2
Baths
1,164
Sq Ft
$883/Sq Ft
Est. Value
About This Home
This home is located at 21635 Audubon Way, Lake Forest, CA 92630 and is currently estimated at $1,027,911, approximately $883 per square foot. 21635 Audubon Way is a home located in Orange County with nearby schools including Lake Forest Elementary School, Serrano Intermediate School, and El Toro High School.
Ownership History
Date
Name
Owned For
Owner Type
Purchase Details
Closed on
Mar 14, 2025
Sold by
Tong Nga Thuy and Tong Nga Thuy
Bought by
2025 Nga Thuy Thi Tong Revocable Trust and Tong
Current Estimated Value
Purchase Details
Closed on
Jun 7, 2005
Sold by
Vanvanphan Tuan Van
Bought by
Tong Nga Thuy
Home Financials for this Owner
Home Financials are based on the most recent Mortgage that was taken out on this home.
Original Mortgage
$375,000
Interest Rate
5.72%
Mortgage Type
Stand Alone First
Purchase Details
Closed on
Mar 24, 2000
Sold by
Joseph Pungerchar Dennis and Joseph Dianna M
Bought by
Vanvanphan Tuan Van and Tong Nga Thuy
Home Financials for this Owner
Home Financials are based on the most recent Mortgage that was taken out on this home.
Original Mortgage
$209,000
Interest Rate
8.26%
Create a Home Valuation Report for This Property
The Home Valuation Report is an in-depth analysis detailing your home's value as well as a comparison with similar homes in the area
Home Values in the Area
Average Home Value in this Area
Purchase History
| Date | Buyer | Sale Price | Title Company |
|---|---|---|---|
| 2025 Nga Thuy Thi Tong Revocable Trust | -- | None Listed On Document | |
| Tong Nga Thuy | -- | Orange Coast Title Company | |
| Vanvanphan Tuan Van | $235,000 | Orange Coast Title |
Source: Public Records
Mortgage History
| Date | Status | Borrower | Loan Amount |
|---|---|---|---|
| Previous Owner | Tong Nga Thuy | $375,000 | |
| Previous Owner | Vanvanphan Tuan Van | $209,000 |
Source: Public Records
Tax History Compared to Growth
Tax History
| Year | Tax Paid | Tax Assessment Tax Assessment Total Assessment is a certain percentage of the fair market value that is determined by local assessors to be the total taxable value of land and additions on the property. | Land | Improvement |
|---|---|---|---|---|
| 2025 | $3,661 | $361,177 | $240,396 | $120,781 |
| 2024 | $3,661 | $354,096 | $235,683 | $118,413 |
| 2023 | $3,575 | $347,153 | $231,061 | $116,092 |
| 2022 | $3,511 | $340,347 | $226,531 | $113,816 |
| 2021 | $3,442 | $333,674 | $222,089 | $111,585 |
| 2020 | $3,411 | $330,253 | $219,812 | $110,441 |
| 2019 | $3,343 | $323,778 | $215,502 | $108,276 |
| 2018 | $3,281 | $317,430 | $211,277 | $106,153 |
| 2017 | $3,215 | $311,206 | $207,134 | $104,072 |
| 2016 | $3,162 | $305,104 | $203,072 | $102,032 |
| 2015 | $3,052 | $300,522 | $200,022 | $100,500 |
| 2014 | $2,984 | $294,636 | $196,104 | $98,532 |
Source: Public Records
Map
Nearby Homes
- 21902 Raintree Ln
- 21676 Rushford Dr
- 21721 Rushford Dr
- 27241 Las Nieves
- 21952 Esplendor
- 21441 Montbury Dr
- 21282 Hillside Ct
- 22081 Broken Bow Dr
- 27122 Valleymont Rd
- 27436 Sereno
- 26474 Sagewood Unit 14
- 21076 Cranbridge Dr
- 21951 Jinetes
- 302 Summit Crest Dr
- 20904 Parkside
- 22292 Silent Brook
- 22322 Silent Brook
- 21955 Bacalar
- 22212 Summit Hill Dr Unit 18
- 21881 Bacalar
- 21641 Audubon Way
- 21631 Audubon Way
- 21651 Audubon Way
- 21621 Audubon Way
- 21611 Audubon Way
- 21636 Audubon Way
- 21632 Audubon Way
- 21642 Audubon Way
- 21622 Audubon Way
- 21652 Audubon Way
- 21601 Audubon Way
- 21612 Audubon Way
- 21662 Audubon Way
- 21595 Audubon Way
- 21602 Audubon Way
- 21666 Audubon Way
- 21661 Vintage Way
- 21671 Vintage Way
- 21651 Vintage Way
- 21681 Vintage Way